Warning: fopen(/home/virtual/arm/journal/upload/ip_log/ip_log_2025-04.txt): failed to open stream: Permission denied in /home/virtual/lib/view_data.php on line 95 Warning: fwrite() expects parameter 1 to be resource, boolean given in /home/virtual/lib/view_data.php on line 96 Ultrasound Imaging of the Trunk Muscles in Acute Stroke Patients and Relations With Balance Scales
  • KARM
  • Contact us
  • E-Submission
ABOUT
ARTICLE TYPES
BROWSE ARTICLES
AUTHOR INFORMATION

Articles

Original Article

Ultrasound Imaging of the Trunk Muscles in Acute Stroke Patients and Relations With Balance Scales

Yunho Kim, MDorcid, Jeeyoung Kim, MDorcid, Heesung Nam, MDorcid, Hyun Dong Kim, MD, PhDorcid, Mi Ja Eom, MDorcid, Sang Hoon Jung, MDorcid, Nami Han, MD, PhDorcid
Annals of Rehabilitation Medicine 2020;44(4):273-283.
Published online: July 28, 2020

Department of Physical Medicine and Rehabilitation, Inje University Busan Paik Hospital, Inje University College of Medicine, Busan, Korea

Corresponding author: Nami Han Department of Physical Medicine and Rehabilitation, Inje University Busan Paik Hospital, 75 Bokji-ro, Busanjin-gu, Busan 47392, Korea. Tel: +82-51-890-6295, Fax: +82-51-890-5804, E-mail: rehabit@inje.ac.kr
• Received: August 14, 2019   • Revised: September 17, 2019   • Accepted: October 30, 2019

Copyright © 2020 by Korean Academy of Rehabilitation Medicine

This is an Open Access article distributed under the terms of the Creative Commons Attribution Non-Commercial License (http://creativecommons.org/licenses/by-nc/4.0/) which permits unrestricted non-commercial use, distribution, and reproduction in any medium, provided the original work is properly cited.

  • 7,659 Views
  • 173 Download
  • 11 Web of Science
  • 9 Crossref
  • 11 Scopus
prev next
  • Objective
    To examine the correlation between ultrasonographic trunk muscle parameters and balance scales in mild acute stroke patients.
  • Methods
    A total of 55 stroke patients with hemiparesis and motor power grade ≥4 in the manual motor test were included. The Scale for the Assessment and Rating of Ataxia (SARA), Berg Balance Scale (BBS), Timed Up and Go Test (TUG), and Trunk Control Test (TCT) were used to evaluate patient balance function. Ultrasonographic parameters were measured on both non-paretic and paretic sides of the rectus abdominis, external oblique, internal oblique, transversus abdominis, and erector spinae muscles. Resting thickness and contraction thickness were measured in all muscles, and contractility and contractility ratio were calculated based on measured thicknesses. The differences between paretic and non-paretic muscle parameters, and the correlation between ultrasonographic parameters and balance scales were analyzed. Stroke patients were divided into two groups according to their fall risk. Ultrasonographic measurements between the two groups were compared.
  • Results
    All muscles’ contraction thickness and contractility were significantly different between paretic and non-paretic sides (p<0.001). Contractility ratios of all trunk muscles showed a significant correlation with SARA, BBS, TUG, and TCT (p<0.05). Contractility ratios of all muscles were significantly different between high- and low-risk fall groups (p<0.05).
  • Conclusion
    The contractility ratio in stroke patients reflects their balance disturbance and fall risk and it may serve as a new parameter for ultrasound imaging of trunk muscles.
The trunk is the largest part of the human body and plays a significant role in the stabilization and movement of multiple body parts. It contributes to maintaining a good posture, moving limbs against gravity, and smoothly connecting different postures by core movement [1]. It is common that stroke patients have difficulty to selectively control the functional movement of trunk muscles, even if there is no severe damage on their hemiparetic sides, and abnormal control of trunk muscles results in waste of energy and balance dysfunction [2,3]. Poor trunk muscle control leads to poor sitting/standing balance, decreased functional movement of the upper and lower extremities, increased risk of fall, and decreased level of independence in activities of daily living (ADL). Several studies have reported that the level of balance at the time of hospital admission is correlated with the average length of hospital stay and functional improvement after treatment [4-6]. One study even suggested that trunk muscle control ability in the early stage of stroke is a strong predictor for the outcome of ADL at 6 months after stroke [7]. The relationship of trunk performance after stroke with balance and gait has been also demonstrated in a previous study [8]. Thus, appropriate trunk muscle control is essential for most physical activities, signifying that accurate measurement of the trunk muscle and their performance is important in stroke patients.
There are several tools that measure balance and trunk function, namely the Berg Balance Scale (BBS), Timed Up and Go Test (TUG), and Trunk Control Test (TCT). These tests are easily accessible and affordable without requiring additional equipment or expenses, hence widely used clinically [9]. The Scale for the Assessment and Rating of Ataxia (SARA) can be additionally used to evaluate motor control of stroke patients together with tools with proven reliability (e.g., BBS, TUG, TCT). SARA can be a complementary tool, because it includes more detailed evaluation subscales for trunk muscle control such as gait, stance, and sitting [10].
The following muscles are most frequently evaluated for association with trunk stability: rectus abdominis (RA), transversus abdominis (TrA), external oblique/internal oblique (EO/IO) abdominis, erector spinae (ES), multifidus, gluteus, iliopsoas, diaphragm in the rear part, and hip muscles. Although each muscle associated with trunk stability has a unique role, it is reported that the muscles act through co-contraction to establish trunk stabilization [11]. Therefore, multiple trunk muscles should be evaluated together, rather than selecting just one as a representative. Trunk muscles not only stabilize the body in the static state, but are also important for the dynamic balance during all functional movements [12]. Therefore, to evaluate trunk muscles, anatomical approaches without consideration of muscle performance are not sufficient to monitor their dynamic function.
To date, many studies have been performed to evaluate trunk-stabilizing muscles using different methods, including isokinetic machine, manual dynamometer, electromyography (EMG), computed tomography (CT), magnetic resonance image (MRI), and musculoskeletal ultrasonography, not only in healthy individuals but also in patients with lower back pain and stroke. Radiologic evaluations, such as CT and MRI, are only available for static evaluation and are difficult to be conducted repeatedly because of their high cost. Isokinetic machine can reveal the functional aspect of trunk muscles, but it cannot measure the function of individual muscles separately. As EMG is invasive, it is painful and inconvenient for patients. In contrast, ultrasound is an easy and economical examination to measure the thickness of trunk muscle. It also has the advantage of monitoring dynamic components, since it can measure the change of thickness when performing an action [3,13,14]. Various studies focusing on abdominal muscles have shown that thickness on contraction measured with ultrasound is associated with EMG recruitment [15,16]. Another study showed a comparable result in the paraspinal muscles as well [17]. Based on this, ultrasound imaging is expanding its rolls as a functional evaluation tool for rehabilitation.
This study aimed to measure both static and dynamic parameters in trunk muscles with ultrasound imaging and to reveal which parameters may be related to balance assessment tools (BBS, TUG, TCT, SARA) in stroke patients with mild hemiparesis, who have balance disturbance without significant weakness in the paretic limbs. In addition, this study sought to identify the difference of the ultrasonographic parameters of trunk muscles between two groups classified according to fall risk.
Study design and patients
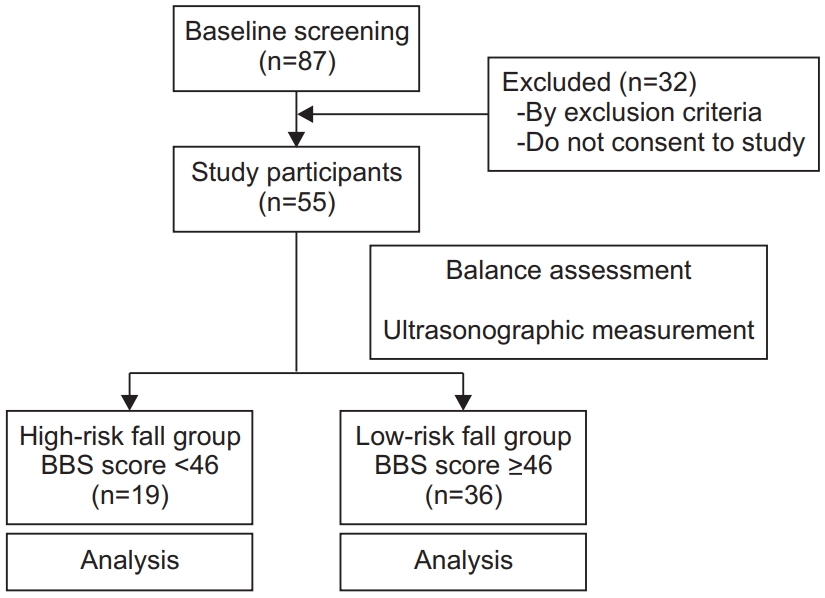
This is a single-center, prospective, cross-sectional, and non-blinded study. Participants were selected from stroke patients consulted at the Rehabilitation Department of Inje University Busan Paik Hospital in 2018. Baseline screening was performed through medical records and study participants were subjected to additional physical examinations, balance scales and ultrasonographic measurement. The following patient inclusion criteria were applied: (1) first incidence of stroke; (2) patients who were out of absolute bed rest state; (3) acute stroke patients (stroke event <1 month) [18,19]; and (4) hemiparetic stroke patients with motor power grade ≥4 according to the manual motor test (MMT) at all movements of upper and lower extremities. The following exclusion criteria were applied: (1) history of lumbar or abdominal operations; (2) history of previous brain lesions; (3) sensory disturbance of light touch and pain on the hemiparetic side; (4) cognitive impairment and Mini-Mental State Examination (MMSE) score <26; and (5) medical instability. Consequently, 55 patients were recruited as study participants and divided into the following two groups according to their fall risk, which was measured with BBS: high-risk fall group (n=19) was defined as patients with BBS score <46 and the low-risk fall group (n=36) with BBS ≥46 [20]. The flow chart of this study is shown in Fig. 1. The present study was approved by the Institutional Review Board of Inje University Busan Paik Hospital (No. 18-0062) and all patients provided informed consent prior to their participation.
Measurement and procedure
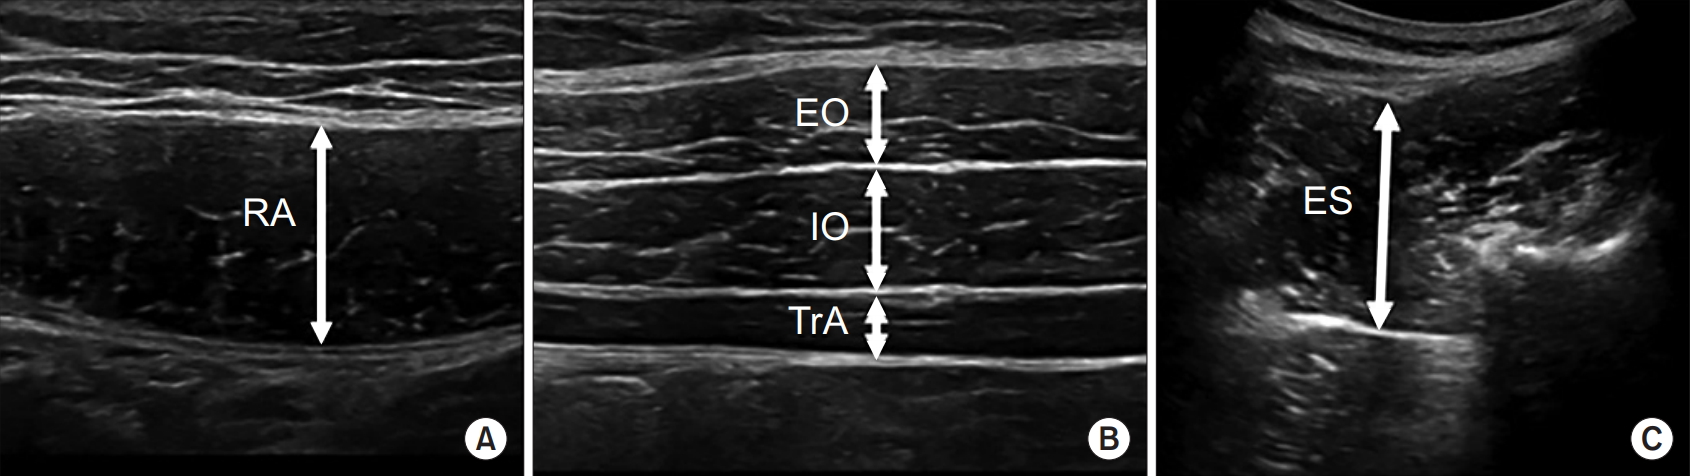
Assessments using balance scales were performed after patients were out of absolute bed rest. We used SARA, BBS, TUG, and TCT as evaluation tools. After evaluation of balance scales, ultrasonographic parameters were measured on both the non-paretic and paretic sides of the RA, EO, IO, TrA, and ES (Fig. 2). Thickness of the resting and contraction states according to the adequate position was measured. Based on this, contractility and contractility ratio were measured as dynamic parameters. Contractility, which indicates the contraction ability of a muscle, was calculated by dividing contraction thickness by resting thickness. Contractility ratio, which reflects the difference of contraction ability between both sides of the body, was calculated by dividing contractility of the unaffected side by contractility of the affected side.
A physician with >2 years of professional experience was appointed as an evaluator. LOGIQ e Ultrasound (GE Healthcare, Milwaukee, WI, USA) equipped with a linear probe (5–12 MHz) for the abdominal muscles and a round probe (2–5.5 MHz) for the ES muscle was used. In the supine position, the linear ultrasound probe was placed transversely 3 cm lateral to the umbilicus for the RA. For the oblique and TrA muscles, the probe was placed vertically at the umbilicus line and horizontally 3 cm medial to the mid-axillary line [21,22]. In the prone position, the round ultrasound probe was placed longitudinally 4 cm lateral to the L4 spinous process level [23]. Abdominal bracing can contract the abdominal muscles simultaneously while pushing them, as if expanding the belly slowly without breathing in a supine hook-lying position. For thickness measurement during contraction of the RA, EO, IO, and TrA muscles, abdominal bracing should be measured with knees placed in a 90° flexed position and both hands placed next to the waist [13,21,24]. For thickness measurement of the ES muscle during contraction, the patient was placed in a prone position with the ipsilateral leg lifted upward as much as possible during measurement and between measurements; sufficient rest for 1–2 minutes was provided [23,25].
Statistical analysis
Windows SPSS version 25.0 (IBM SPSS, Armonk, NY, USA) was used for statistical analysis, and the level of statistical significance was set at p<0.05. For baseline characteristics, all data were expressed as mean±standard deviation. We used paired t-test to analyze the differences between the paretic and non-paretic muscle parameters. The correlations between ultrasonographic parameters and balance scales were calculated through a Pearson correlation coefficient analysis. The Mann-Whitney U-test was used to compare ultrasonographic parameters between the high- and low-risk fall groups.
Patients’ characteristics
A total of 55 patients with stroke (infarction, n=42; hemorrhage, n=13) were included in this study. Patients’ characteristics are summarized in Table 1. Patients’ average age was 70.00±15.28 years in the high-risk fall group and 61.97±12.32 years in the low-risk fall group. The duration from stroke incidence to evaluation was 9.79±9.77 days in the high-risk fall group and 11.56±10.59 in the low-risk fall group. The average BBS scores were 38.42±7.75 in the high-risk fall group and 51.31±2.93 in the low-risk fall group.
Non-paretic and paretic side difference
There were differences in contraction thickness and contractility among all muscles between paretic and non-paretic sides. Contractility was significantly lower at the paretic side than at the non-paretic side (p<0.001) for every trunk muscle. The resting thickness of the RA and EO muscles showed no significant difference between non-paretic and paretic sides (Table 2).
Correlation between ultrasonographic parameters and balance scales
Only the contractility of the RA and IO muscles at the non-paretic side showed significant correlation with all balance scales. Only the contractility of the ES muscles at the paretic side showed significant correlation with BBS and TUG. In contrast, the contractility ratios of all trunk muscles showed significant correlation with SARA, BBS, TUG, and TCT (Table 3).
When comparing according to the fall risk, the contractility ratios of all muscles were different between the two groups. However, thickness and contractility of individual muscles showed various results (Table 4).
Proper balance is essential for normal body function. To maintain balance, when a destabilizing force is applied under a gravitational field, the center of gravity must be positioned perpendicular to the center of the support base [26,27]. Changes in the center of gravity or support base require the coordinated activity not only from lower extremity muscles but also from trunk stability muscles to restore the force equilibrium and to preserve balance [3]. In this imbalanced state, trunk stability involves maintaining both resting or contraction state and performing various dynamic movements, which are related to adequate contraction of the muscles [28]. Based on this, we evaluated not only the thickness of various muscles as a static parameter, but also contractility and contractility ratio as dynamic components and attempted to apply the contractility ratio as a diagnostic tool for rehabilitative ultrasound imaging to reflect the difference between both sides.
Balance is dominated by various proper senses including proprioception and by trunk motor power as well as the power of the upper and lower extremities [29]. We selected patients with MMT grade ≥4, without sensory disturbance of light touch and pain in upper and lower extremities, to minimize the influence from limb dysfunction. To focus on the relationship between balance and contraction ability of trunk muscles, proprioception was not considered as a variation, because it is the main factor that can directly affect positioning of trunk muscles [1]. In addition, we recruited stroke patients in acute phase to reduce the effect of atrophy and intramuscular fat deposition, which start to occur at 3 weeks to 6 months after stroke and are clearly observed more than 6 months after stroke [30-32].
Analysis of paretic and the non-paretic sides showed that most parameters were different between sides. Specifically, contraction thickness and contractility, which reflect the dynamic function of trunk muscles, were significantly lower on the hemiparetic side. While resting thickness, which is a static parameter, showed no side-to-side difference in RA and EO, it was significantly different in IO, TA, and ES. In a previous study examining the thickness of abdominal muscles, it was reported that the difference of resting thickness between the two sides of the body depends on gender, dominant hand, and the type of muscle [33,34]. This suggests that the side-toside symmetry of resting thickness of abdominal muscle appears to be diverse between individuals and muscles. Therefore, to observe side-to-side differences of trunk muscles, parameters that reflect the ability of contraction other than resting thickness should be measured. Our results also show the importance of dynamic parameters, noting that contraction thickness and contractility of RA and EO were significantly different while resting thickness of the same muscles did not display any difference.
Unlike limb muscles, the innervation of the trunk muscles is supplied from both cerebral hemispheres so that over time, atrophy and intramuscular fat deposition occurs in both sides. In studies conducted on stroke patients in chronic phase to examine bilateral lateral abdominis, it appeared that contraction thickness on paretic and the non-paretic sides was different only in TrA [35]. This inconsistency with our results is assumed that the patients enrolled in this study were influenced by the affected central nervous system only before the change of muscle structure occurred because they were in acute phase at the time of evaluation.
Regarding the correlation between balance scales and ultrasonographic parameters, a significant relationship between contractility ratio and all balance scales was found for all muscles. When all data were analyzed, only contractility ratio was associated with all muscles and all balance scales, whereas other parameters did not show consistent results. Similarly, in the patient groups classified by the degree of fall risk according to the BBS score, only contractility ratio showed a difference in all trunk muscles. In hemiparesis patients, the power difference in limb muscle of the two sides is positively correlated with balance disturbance. Decreased power of individual trunk motion is hard to be recognized in the clinic, especially when patients present with relatively preserved motor function in the affected limb. Mild stroke patients are often recruited to early rehabilitation programs and face balance disturbance that is not expected based on their good motor function. However, it had been complicated to measure the motor function of the two sides of the trunk muscles and compare them quantitatively. Based on our results, a clear contractility difference of trunk muscles can be measured with ultrasonography, so that the veiled risk of falls can be detected before and during the rehabilitation program.
The mechanism of selective action of the trunk muscles according to muscle layer and muscle type has not been examined sufficiently in the balance of stroke patients. In this study, there are several significant results regarding individual muscles. For the abdominal muscles, there is a significant correlation between non-paretic side contractility of RA and IO, and balance scales. A normal pattern of increasing order of mean abdominal muscle thickness is TrA<EO<IO<RA [36]. Considering that contractility of the paretic side does not correlate with balance in all other abdominal muscles, it is possible that mild stroke patients adjust their balance under the influence of the relatively thicker abdominal muscles, such as RA and IO, at the non-paretic side. On the other hand, paretic side contractility of ES showed a significant correlation with balance scales. These results suggest that compensatory function of non-paretic side is important in the abdominal muscles to maintaining trunk balance, whereas decreased function of ES in the paretic side acts as a deterrent to the overall balance. Furthermore, the contractility ratio of ES is related to balance in stroke patients, and all parameters of ES, except for non-paretic side contractility, showed a significant difference between the two fall risk groups. Kasukawa et al. [37] found that elderly fall patients had significantly lower levels of maximal back extensor strength than non-fall patients. Karatas et al. [3] showed that both trunk flexion and extension motor power in unihemispheric stroke patients interferes with balance, stability, and functional disability. This result is consistent with this study and indicates the importance of back extensor, which affects balance and fall risk. The majority of ultrasonographic research related to the trunk muscle of stroke patients is limited to the assessment of abdominal muscles. A few studies only compared thickness of the muscle at the paretic and the non-paretic sides using ultrasonography. To the best of our knowledge, no study has measured paraspinal muscles together with abdominal muscles using ultrasound, when evaluating the balance of stroke patients. Considering that measuring the dynamic thickness of paraspinal muscles with ultrasonography is simple and convenient, it should be included when evaluating trunk muscles for balance function; in addition, ES is reasonable to be selected among paraspinal muscles, because it affects extension strength and is more reliably measured than the multifidus [38].
There are several limitations to our study. First, appropriate continuous follow-up evaluation should have been included periodically, but it was limited only to the cross-sectional study. We recommend that future studies seek appropriate training directions by measuring the balance scale and contractility ratio periodically after physical therapy. Second, because the patients were acute patients, they were immediately out of absolute bed rest state, so function and mobility were reduced, and the balance scale may have been under-estimated. Third, despite sufficient explanation and resting time between performances, elderly patients had difficulty in performing instructed movements during contraction, which may have resulted in lower values of contractility and resting thickness than those expected, because maximal muscle contraction cannot be achieved when patients perform a movement. Fourth, influence of proprioceptive dysfunction was not clearly demonstrated because proprioception was not a criterion for participant recruitment. Further studies are required to examine the effect of proprioceptive dysfunction on trunk motion and balance.
In conclusion, the contractility ratio in stroke patients reflects their balance disturbance and fall risk. It can serve as a new parameter for ultrasound imaging of trunk muscles. Resting thickness alone is not sufficient to assess the function of trunk muscles. Ultrasonographic trunk measurement is an easy-to-use and reliable evaluation tool that can be used periodically and provides a guide to set quantitative goals for patients who want to improve their balance.

No potential conflict of interest relevant to this article was reported.

Conceptualization: Kim Y, Han N, Jung SH. Methodology: Kim Y, Han N. Formal analysis: Kim Y, Kim J. Project administration: Kim Y, Kim J. Visualization: Kim Y, Kim J, Nam H. Writing - original draft: Kim Y. Writing - review and editing: Han N, Kim HD, Eom MJ. Approval of the final manuscript: all authors.

Fig. 1.
Flow chart of the study design. A total of 55 patients were selected as study participants. BBS, Berg Balance Scale.
arm-19125f1.jpg
Fig. 2.
Ultrasonographic images of the RA muscle (A), lateral abdominal muscle (B), and ES muscle (C). Thickness was measured in the resting and contraction states. RA, rectus abdominis; EO, external oblique; IO, internal oblique; TrA, transversus abdominis; ES, erector spinae.
arm-19125f2.jpg
Table 1.
Demographics and characteristics of patients (n=55)
Characteristic High-risk fall group (n=19) Low-risk fall group (n=36)
Sex
 Male 10 24
 Female 9 12
Age (yr) 70.00±15.28 61.97±12.32
BMI (kg/m2) 22.45±1.87 23.91±2.86
Duration from stroke onset to examination (day) 9.53±9.82 12.44±10.99
Hospitalization period (day) 17.89±12.14 14.86±11.87
Stroke type and lesion
 Infarction 15 27
  Cerebellum 0 4
  BG or capsula interna 2 0
  Thalamus 1 3
  Pontine and medullar lesion 2 1
  Multiple lesion 10 19
 Hemorrhage 4 9
Side of lesion
 Right 12 22
 Left 7 14
Smoking
 Yes 1 11
 No 18 25
Cardiovascular disease
 Yes 1 4
 No 18 32
Left ventricular hypertrophy
 Yes 0 1
 No 19 35
Hypertension
 Yes 9 16
 No 10 20
Diabetes mellitus
 Yes 5 7
 No 14 29
Atrial fibrillation
 Yes 0 4
 No 19 32
NIHSS on admission 4.11±2.10 3.06±3.96
mRS on admission 2.58±0.92 1.53±1.44
SARA score 8.61±4.43 2.46±2.14
BBS 38.42±7.75 51.31±2.93
TUG test 24.29±8.84 12.81±53.7
TCT 95.21±10.76 100±0.00

Values are presented as mean±standard deviation or as number (%).

BMI, body mass index; BG, basal ganglia; NIHSS, National Institutes of Health Stroke Scale; mRS, modified Rankin Scale; SARA, Scale for the Assessment and Rating of Ataxia; BBS, Berg Balance Scale; TUG, Timed Up and Go Test; TCT, Trunk Control Test.

Table 2.
Ultrasonographic values for the paretic and non-paretic side of trunk muscles
Non-paretic Paretic p-value
Rectus abdominis
 Resting thickness (mm) 7.60±2.26 7.49±2.42 0.337
 Contraction thickness (mm) 8.95±2.54 8.22±2.64 <0.001*
 Contractility 1.19±0.12 1.10±0.10 <0.001*
External oblique
 Resting thickness (mm) 3.60±1.22 3.56±1.04 0.675
 Contraction thickness (mm) 4.54±1.43 4.14±1.25 <0.001*
 Contractility 1.28±0.19 1.16±0.14 <0.001*
Internal oblique
 Resting thickness (mm) 6.70±2.21 6.48±2.09 0.042*
 Contraction thickness (mm) 8.68±2.71 7.74±2.49 <0.001*
 Contractility 1.30±0.15 1.20±1.32 <0.001*
Transversus abdominis
 Resting thickness (mm) 3.16±1.35 3.00±1.29 0.047*
 Contraction thickness (mm) 4.99±2.09 4.26±1.95 <0.001*
 Contractility 1.62±0.49 1.43±0.43 <0.001*
Erector spinae
 Resting thickness (mm) 37.51±6.19 36.71±6.12 0.045*
 Contraction thickness (mm) 44.47±6.56 41.40±7.00 <0.001*
 Contractility 1.19±0.11 1.13±0.09 <0.001*

Values are presented as mean±standard deviation.

*p<0.05 by paired t-test.

Table 3.
Correlation coefficients between ultrasonographic trunk muscle parameters and balance scales in stroke patients
Pearson correlation coefficient
SARA BBS TUG TCT
Rectus abdominis
 NPS thickness -0.184 0.191 -0.221 0.101
 PS thickness -0.168 0.184 -0.240 -0.221
 NPS contractility 0.431** -0.434** 0.340* -0.371**
 PS contractility 0.067 -0.065 0.068 0.058
 Contractility ratio 0.529** -0.534** 0.393** -0.605**
External oblique
 NPS thickness -0.263 0.309* -0.385** 0.118
 PS thickness -0.342 0.355 -0.420 -0.213
 NPS contractility 0.212 -0.212 0.089 -0.232
 PS contractility -0.222 0.194 -0.241 0.175
 Contractility ratio 0.562** -0.533** 0.414** -0.542**
Internal oblique
 NPS thickness -0.115 0.161 -0.220 0.060
 PS thickness -0.130 0.192 -0.274 0.077
 NPS contractility 0.497** -0.491** 0.439** -0.395**
 PS contractility -0.083 0.100 -0.066 0.063
 Contractility ratio 0.659** -0.673** 0.568** -0.541**
Transversus abdominis
 NPS thickness -0.118 0.091 -0.119 0.200
 PS thickness -0.131 0.102 -0.149 0.192
 NPS contractility -0.029 0.063 -0.031 -0.110
 PS contractility -0.237 0.247 -0.215 0.070
 Contractility ratio 0.374** -0.337* 0.311* -0.320*
Erector spinae
 NPS thickness -0.313* 0.392** -0.298* 0.134
 PS thickness -0.236 0.306* -0.243 0.035
 NPS contractility 0.170 -0.092 0.014 0.024
 PS contractility -0.237 0.301* -0.354** 0.191
 Contractility ratio 0.562** -0.533** 0.414** -0.542**

Value of NPS thickness and PS thickness was measured on resting state.

NPS, non-paretic side; PS, paretic side; SARA, Scale for the Assessment and Rating of Ataxia; BBS, Berg Balance Scale; TUG, Timed Up and Go Test; TCT, Trunk Control Test.

*p<0.05,

**p<0.01 by Pearson correlation coefficient analysis.

Table 4.
Comparison of ultrasonographic trunk muscle parameters between the high- and low-risk fall groups classified according to Berg Balance Scale
High-risk fall group (n=19) Low-risk fall group (n=36) p-value
Rectus abdominis
 NPS thickness (mm) 6.94±2.20 7.95±2.23 0.117
 PS thickness (mm) 6.86±2.45 7.81±2.36 0.103
 NPS contractility 1.23±0.13 1.16±1.10 0.061
 PS contractility 1.10±0.09 1.10±0.10 0.852
 Contractility ratio 1.11±0.09 1.06±0.06 0.001**
External oblique
 NPS thickness (mm) 3.09±1.27 3.86±1.12 0.011*
 PS thickness (mm) 3.12±1.08 3.79±0.95 0.008*
 NPS contractility 1.32±0.19 1.26±0.19 0.193
 PS contractility 1.15±0.13 1.17±0.15 0.710
 Contractility ratio 1.15±0.16 1.07±0.08 0.048*
Internal oblique
 NPS thickness (mm) 6.06±1.79 7.05±2.36 0.159
 PS thickness (mm) 5.73±1.83 6.88±2.14 0.037*
 NPS contractility 1.37±0.14 1.27±0.14 0.044*
 PS contractility 1.17±0.13 1.20±0.13 0.381
 Contractility ratio 1.16±0.14 1.05±0.07 <0.001**
Transversus abdominis
 NPS thickness (mm) 2.91±1.36 3.30±1.34 0.125
 PS thickness (mm) 2.76±1.34 3.13±1.26 0.172
 NPS contractility 1.57±3.55 1.65±0.51 0.979
 PS contractility 1.28±0.27 1.51±0.47 0.026*
 Contractility ratio 1.25±0.33 1.09±0.14 <0.001**
Erector spinae
 NPS thickness (mm) 33.7±4.27 39.5±6.15 0.001**
 PS thickness (mm) 33.9±4.02 38.1±6.55 0.019*
 NPS contractility 1.20±0.13 1.18±0.09 0.818
 PS contractility 1.10±0.07 1.14±0.09 0.028*
 Contractility ratio 1.10±0.07 1.04±0.04 0.002**

Values are presented as mean±standard deviation.

Value of NPS thickness and PS thickness was measured on resting state.

NPS, non-paretic side; PS, paretic side.

*p<0.05,

**p<0.01 by Mann-Whitney U-test.

  • 1. Ryerson S, Byl NN, Brown DA, Wong RA, Hidler JM. Altered trunk position sense and its relation to balance functions in people post-stroke. J Neurol Phys Ther 2008;32:14-20.
  • 2. Yu SH, Park SD. The effects of core stability strength exercise on muscle activity and trunk impairment scale in stroke patients. J Exerc Rehabil 2013;9:362-7.
  • 3. Karatas M, Cetin N, Bayramoglu M, Dilek A. Trunk muscle strength in relation to balance and functional disability in unihemispheric stroke patients. Am J Phys Med Rehabil 2004;83:81-7.
  • 4. Juneja G, Czyrny JJ, Linn RT. Admission balance and outcomes of patients admitted for acute inpatient rehabilitation. Am J Phys Med Rehabil 1998;77:388-93.
  • 5. Sandin KJ, Smith BS. The measure of balance in sitting in stroke rehabilitation prognosis. Stroke 1990;21:82-6.
  • 6. Bohannon RW, Leary KM. Standing balance and function over the course of acute rehabilitation. Arch Phys Med Rehabil 1995;76:994-6.
  • 7. Hsieh CL, Sheu CF, Hsueh IP, Wang CH. Trunk control as an early predictor of comprehensive activities of daily living function in stroke patients. Stroke 2002;33:2626-30.
  • 8. Verheyden G, Vereeck L, Truijen S, Troch M, Herregodts I, Lafosse C, et al. Trunk performance after stroke and the relationship with balance, gait and functional ability. Clin Rehabil 2006;20:451-8.
  • 9. Winser SJ, Smith C, Hale LA, Claydon LS, Whitney SL. Balance outcome measures in cerebellar ataxia: a Delphi survey. Disabil Rehabil 2015;37:165-70.
  • 10. Kim BR, Lim JH, Lee SA, Park S, Koh SE, Lee IS, et al. Usefulness of the scale for the assessment and rating of ataxia (SARA) in ataxic stroke patients. Ann Rehabil Med 2011;35:772-80.
  • 11. Richardson CA, Jull GA. Muscle control-pain control. What exercises would you prescribe? Man Ther 1995;1:2-10.
  • 12. Marshall PW, Murphy BA. Core stability exercises on and off a Swiss ball. Arch Phys Med Rehabil 2005;86:242-9.
  • 13. McMeeken JM, Beith ID, Newham DJ, Milligan P, Critchley DJ. The relationship between EMG and change in thickness of transversus abdominis. Clin Biomech (Bristol, Avon) 2004;19:337-42.
  • 14. Hodges PW, Pengel LH, Herbert RD, Gandevia SC. Measurement of muscle contraction with ultrasound imaging. Muscle Nerve 2003;27:682-92.
  • 15. Ferreira PH, Ferreira ML, Hodges PW. Changes in recruitment of the abdominal muscles in people with low back pain: ultrasound measurement of muscle activity. Spine (Phila Pa 1976) 2004;29:2560-6.
  • 16. Ferreira PH, Ferreira ML, Nascimento DP, Pinto RZ, Franco MR, Hodges PW. Discriminative and reliability analyses of ultrasound measurement of abdominal muscles recruitment. Man Ther 2011;16:463-9.
  • 17. Kiesel KB, Uhl TL, Underwood FB, Rodd DW, Nitz AJ. Measurement of lumbar multifidus muscle contraction with rehabilitative ultrasound imaging. Man Ther 2007;12:161-6.
  • 18. Peurala SH, Karttunen AH, Sjogren T, Paltamaa J, Heinonen A. Evidence for the effectiveness of walking training on walking and self-care after stroke: a systematic review and meta-analysis of randomized controlled trials. J Rehabil Med 2014;46:387-99.
  • 19. Hatem SM, Saussez G, Della Faille M, Prist V, Zhang X, Dispa D, et al. Rehabilitation of motor function after stroke: a multiple systematic review focused on techniques to stimulate upper extremity recovery. Front Hum Neurosci 2016;10:442.
  • 20. Bogle Thorbahn LD, Newton RA. Use of the Berg Balance Test to predict falls in elderly persons. Phys Ther 1996;76:576-83.
  • 21. Kim HD, Jeon DM, Bae HW, Kim JG, Han N, Eom MJ. Changes in activation of abdominal muscles at selected angles during trunk exercise by using ultrasonography. Ann Rehabil Med 2015;39:950-6.
  • 22. Teyhen DS, Gill NW, Whittaker JL, Henry SM, Hides JA, Hodges P. Rehabilitative ultrasound imaging of the abdominal muscles. J Orthop Sports Phys Ther 2007;37:450-66.
  • 23. Watanabe K, Miyamoto K, Masuda T, Shimizu K. Use of ultrasonography to evaluate thickness of the erector spinae muscle in maximum flexion and extension of the lumbar spine. Spine (Phila Pa 1976) 2004;29:1472-7.
  • 24. Kim HD, You JM, Han N, Eom MJ, Kim JG. Ultrasonographic measurement of transverse abdominis in stroke patients. Ann Rehabil Med 2014;38:317-26.
  • 25. Stokes M, Hides J, Elliott J, Kiesel K, Hodges P. Rehabilitative ultrasound imaging of the posterior paraspinal muscles. J Orthop Sports Phys Ther 2007;37:581-95.
  • 26. Horak FB. Clinical measurement of postural control in adults. Phys Ther 1987;67:1881-5.
  • 27. Paulus WM, Straube A, Brandt T. Visual stabilization of posture. Physiological stimulus characteristics and clinical aspects. Brain 1984;107(Pt 4): 1143-63.
  • 28. Granata KP, England SA. Stability of dynamic trunk movement. Spine (Phila Pa 1976) 2006;31:E271-6.
  • 29. Niam S, Cheung W, Sullivan PE, Kent S, Gu X. Balance and physical impairments after stroke. Arch Phys Med Rehabil 1999;80:1227-33.
  • 30. English C, McLennan H, Thoirs K, Coates A, Bernhardt J. Loss of skeletal muscle mass after stroke: a systematic review. Int J Stroke 2010;5:395-402.
  • 31. Jorgensen L, Jacobsen BK. Changes in muscle mass, fat mass, and bone mineral content in the legs after stroke: a 1 year prospective study. Bone 2001;28:655-9.
  • 32. Carin-Levy G, Greig C, Young A, Lewis S, Hannan J, Mead G. Longitudinal changes in muscle strength and mass after acute stroke. Cerebrovasc Dis 2006;21:201-7.
  • 33. Stetts DM, Freund JE, Allison SC, Carpenter G. A rehabilitative ultrasound imaging investigation of lateral abdominal muscle thickness in healthy aging adults. J Geriatr Phys Ther 2009;32:60-6.
  • 34. Rankin G, Stokes M, Newham DJ. Abdominal muscle size and symmetry in normal subjects. Muscle Nerve 2006;34:320-6.
  • 35. Park HJ, Oh DW, Shin WS. The study of asymmetrical contraction of the lateral abdominal muscles in stroke patients using ultrasound imaging. J Korean Soc Phys Med 2012;7:319-27.
  • 36. Tahan N, Khademi-Kalantari K, Mohseni-Bandpei MA, Mikaili S, Baghban AA, Jaberzadeh S. Measurement of superficial and deep abdominal muscle thickness: an ultrasonography study. J Physiol Anthropol 2016;35:17.
  • 37. Kasukawa Y, Miyakoshi N, Hongo M, Ishikawa Y, Noguchi H, Kamo K, et al. Relationships between falls, spinal curvature, spinal mobility and back extensor strength in elderly people. J Bone Miner Metab 2010;28:82-7.
  • 38. Belavy DL, Armbrecht G, Felsenberg D. Real-time ultrasound measures of lumbar erector spinae and multifidus: reliability and comparison to magnetic resonance imaging. Physiol Meas 2015;36:2285-99.

Figure & Data

References

    Citations

    Citations to this article as recorded by  
    • Immediate effects of trunk Kinesio Taping® on functional parameters in the acute stage of patients with mild stroke: A randomized controlled trial
      Asalet Aybüke Güp, Banu Bayar
      Physiotherapy Theory and Practice.2024; 40(7): 1447.     CrossRef
    • Investigation of the reliability and validity of the Turkish version of the Sitting Balance Scale in individuals with stroke
      Kübra Çapraz, Saniye Aydoğan Arslan, Teoman Çolak
      Acta Neurologica Belgica.2024; 124(1): 81.     CrossRef
    • The investigation of ultrasound to assess lateral abdominal wall activation with different types of core exercises
      Nan Hu, Fengshan Huang, Rui Yu, Neil Chen Yi Lun MacAlevey, Yi Zeng, Ping Miao
      BMC Sports Science, Medicine and Rehabilitation.2024;[Epub]     CrossRef
    • Respiratory muscle ultrasonography evaluation and its clinical application in stroke patients: A review
      Xiaoman Liu, Ying Yang, Jie Jia
      Frontiers in Neuroscience.2023;[Epub]     CrossRef
    • BOBATH vs. TASK-ORIENTED TRAINING AFTER STROKE: An assessor-blind randomized controlled trial
      Gülşah Sütçü, Levent Özçakar, Ali İmran Yalçın, Muhammed Kılınç
      Brain Injury.2023; 37(7): 581.     CrossRef
    • Association between trunk core muscle thickness and functional ability in subacute hemiplegic stroke patients: an exploratory cross-sectional study
      Jee Hyun Suh, Eun Chae Lee, Joo Sup Kim, Seo Yeon Yoon
      Topics in Stroke Rehabilitation.2022; 29(3): 163.     CrossRef
    • Ultrasonography of abdominal muscles: Differential diagnosis of late-onset Pompe disease and myotonic dystrophy type 1
      Pei-Chen Hsieh, Chun-Wei Chang, Long-Sun Ro, Chin-Chang Huang, Jia-En Chi, Hung-Chou Kuo
      Frontiers in Neurology.2022;[Epub]     CrossRef
    • Investigation of Structural Changes in Rectus Abdominis Muscle According to Curl-Up Angle Using Ultrasound with an Extended Field of View
      Chansol Park, Hwi-Young Cho, Chang-Ki Kang
      International Journal of Environmental Research and Public Health.2022; 19(21): 14525.     CrossRef
    • Trunk Muscle Activation Patterns During Standing Turns in Patients With Stroke: An Electromyographic Analysis
      I-Hsuan Chen, Pei-Jung Liang, Valeria Jia-Yi Chiu, Shu-Chun Lee
      Frontiers in Neurology.2021;[Epub]     CrossRef

    Download Citation

    Download a citation file in RIS format that can be imported by all major citation management software, including EndNote, ProCite, RefWorks, and Reference Manager.

    Format:

    Include:

    Ultrasound Imaging of the Trunk Muscles in Acute Stroke Patients and Relations With Balance Scales
    Ann Rehabil Med. 2020;44(4):273-283.   Published online July 28, 2020
    Download Citation
    Download a citation file in RIS format that can be imported by all major citation management software, including EndNote, ProCite, RefWorks, and Reference Manager.

    Format:
    • RIS — For EndNote, ProCite, RefWorks, and most other reference management software
    • BibTeX — For JabRef, BibDesk, and other BibTeX-specific software
    Include:
    • Citation for the content below
    Ultrasound Imaging of the Trunk Muscles in Acute Stroke Patients and Relations With Balance Scales
    Ann Rehabil Med. 2020;44(4):273-283.   Published online July 28, 2020
    Close

    Figure

    • 0
    • 1
    Ultrasound Imaging of the Trunk Muscles in Acute Stroke Patients and Relations With Balance Scales
    Image Image
    Fig. 1. Flow chart of the study design. A total of 55 patients were selected as study participants. BBS, Berg Balance Scale.
    Fig. 2. Ultrasonographic images of the RA muscle (A), lateral abdominal muscle (B), and ES muscle (C). Thickness was measured in the resting and contraction states. RA, rectus abdominis; EO, external oblique; IO, internal oblique; TrA, transversus abdominis; ES, erector spinae.
    Ultrasound Imaging of the Trunk Muscles in Acute Stroke Patients and Relations With Balance Scales
    Characteristic High-risk fall group (n=19) Low-risk fall group (n=36)
    Sex
     Male 10 24
     Female 9 12
    Age (yr) 70.00±15.28 61.97±12.32
    BMI (kg/m2) 22.45±1.87 23.91±2.86
    Duration from stroke onset to examination (day) 9.53±9.82 12.44±10.99
    Hospitalization period (day) 17.89±12.14 14.86±11.87
    Stroke type and lesion
     Infarction 15 27
      Cerebellum 0 4
      BG or capsula interna 2 0
      Thalamus 1 3
      Pontine and medullar lesion 2 1
      Multiple lesion 10 19
     Hemorrhage 4 9
    Side of lesion
     Right 12 22
     Left 7 14
    Smoking
     Yes 1 11
     No 18 25
    Cardiovascular disease
     Yes 1 4
     No 18 32
    Left ventricular hypertrophy
     Yes 0 1
     No 19 35
    Hypertension
     Yes 9 16
     No 10 20
    Diabetes mellitus
     Yes 5 7
     No 14 29
    Atrial fibrillation
     Yes 0 4
     No 19 32
    NIHSS on admission 4.11±2.10 3.06±3.96
    mRS on admission 2.58±0.92 1.53±1.44
    SARA score 8.61±4.43 2.46±2.14
    BBS 38.42±7.75 51.31±2.93
    TUG test 24.29±8.84 12.81±53.7
    TCT 95.21±10.76 100±0.00
    Non-paretic Paretic p-value
    Rectus abdominis
     Resting thickness (mm) 7.60±2.26 7.49±2.42 0.337
     Contraction thickness (mm) 8.95±2.54 8.22±2.64 <0.001*
     Contractility 1.19±0.12 1.10±0.10 <0.001*
    External oblique
     Resting thickness (mm) 3.60±1.22 3.56±1.04 0.675
     Contraction thickness (mm) 4.54±1.43 4.14±1.25 <0.001*
     Contractility 1.28±0.19 1.16±0.14 <0.001*
    Internal oblique
     Resting thickness (mm) 6.70±2.21 6.48±2.09 0.042*
     Contraction thickness (mm) 8.68±2.71 7.74±2.49 <0.001*
     Contractility 1.30±0.15 1.20±1.32 <0.001*
    Transversus abdominis
     Resting thickness (mm) 3.16±1.35 3.00±1.29 0.047*
     Contraction thickness (mm) 4.99±2.09 4.26±1.95 <0.001*
     Contractility 1.62±0.49 1.43±0.43 <0.001*
    Erector spinae
     Resting thickness (mm) 37.51±6.19 36.71±6.12 0.045*
     Contraction thickness (mm) 44.47±6.56 41.40±7.00 <0.001*
     Contractility 1.19±0.11 1.13±0.09 <0.001*
    Pearson correlation coefficient
    SARA BBS TUG TCT
    Rectus abdominis
     NPS thickness -0.184 0.191 -0.221 0.101
     PS thickness -0.168 0.184 -0.240 -0.221
     NPS contractility 0.431** -0.434** 0.340* -0.371**
     PS contractility 0.067 -0.065 0.068 0.058
     Contractility ratio 0.529** -0.534** 0.393** -0.605**
    External oblique
     NPS thickness -0.263 0.309* -0.385** 0.118
     PS thickness -0.342 0.355 -0.420 -0.213
     NPS contractility 0.212 -0.212 0.089 -0.232
     PS contractility -0.222 0.194 -0.241 0.175
     Contractility ratio 0.562** -0.533** 0.414** -0.542**
    Internal oblique
     NPS thickness -0.115 0.161 -0.220 0.060
     PS thickness -0.130 0.192 -0.274 0.077
     NPS contractility 0.497** -0.491** 0.439** -0.395**
     PS contractility -0.083 0.100 -0.066 0.063
     Contractility ratio 0.659** -0.673** 0.568** -0.541**
    Transversus abdominis
     NPS thickness -0.118 0.091 -0.119 0.200
     PS thickness -0.131 0.102 -0.149 0.192
     NPS contractility -0.029 0.063 -0.031 -0.110
     PS contractility -0.237 0.247 -0.215 0.070
     Contractility ratio 0.374** -0.337* 0.311* -0.320*
    Erector spinae
     NPS thickness -0.313* 0.392** -0.298* 0.134
     PS thickness -0.236 0.306* -0.243 0.035
     NPS contractility 0.170 -0.092 0.014 0.024
     PS contractility -0.237 0.301* -0.354** 0.191
     Contractility ratio 0.562** -0.533** 0.414** -0.542**
    High-risk fall group (n=19) Low-risk fall group (n=36) p-value
    Rectus abdominis
     NPS thickness (mm) 6.94±2.20 7.95±2.23 0.117
     PS thickness (mm) 6.86±2.45 7.81±2.36 0.103
     NPS contractility 1.23±0.13 1.16±1.10 0.061
     PS contractility 1.10±0.09 1.10±0.10 0.852
     Contractility ratio 1.11±0.09 1.06±0.06 0.001**
    External oblique
     NPS thickness (mm) 3.09±1.27 3.86±1.12 0.011*
     PS thickness (mm) 3.12±1.08 3.79±0.95 0.008*
     NPS contractility 1.32±0.19 1.26±0.19 0.193
     PS contractility 1.15±0.13 1.17±0.15 0.710
     Contractility ratio 1.15±0.16 1.07±0.08 0.048*
    Internal oblique
     NPS thickness (mm) 6.06±1.79 7.05±2.36 0.159
     PS thickness (mm) 5.73±1.83 6.88±2.14 0.037*
     NPS contractility 1.37±0.14 1.27±0.14 0.044*
     PS contractility 1.17±0.13 1.20±0.13 0.381
     Contractility ratio 1.16±0.14 1.05±0.07 <0.001**
    Transversus abdominis
     NPS thickness (mm) 2.91±1.36 3.30±1.34 0.125
     PS thickness (mm) 2.76±1.34 3.13±1.26 0.172
     NPS contractility 1.57±3.55 1.65±0.51 0.979
     PS contractility 1.28±0.27 1.51±0.47 0.026*
     Contractility ratio 1.25±0.33 1.09±0.14 <0.001**
    Erector spinae
     NPS thickness (mm) 33.7±4.27 39.5±6.15 0.001**
     PS thickness (mm) 33.9±4.02 38.1±6.55 0.019*
     NPS contractility 1.20±0.13 1.18±0.09 0.818
     PS contractility 1.10±0.07 1.14±0.09 0.028*
     Contractility ratio 1.10±0.07 1.04±0.04 0.002**
    Table 1. Demographics and characteristics of patients (n=55)

    Values are presented as mean±standard deviation or as number (%).

    BMI, body mass index; BG, basal ganglia; NIHSS, National Institutes of Health Stroke Scale; mRS, modified Rankin Scale; SARA, Scale for the Assessment and Rating of Ataxia; BBS, Berg Balance Scale; TUG, Timed Up and Go Test; TCT, Trunk Control Test.

    Table 2. Ultrasonographic values for the paretic and non-paretic side of trunk muscles

    Values are presented as mean±standard deviation.

    p<0.05 by paired t-test.

    Table 3. Correlation coefficients between ultrasonographic trunk muscle parameters and balance scales in stroke patients

    Value of NPS thickness and PS thickness was measured on resting state.

    NPS, non-paretic side; PS, paretic side; SARA, Scale for the Assessment and Rating of Ataxia; BBS, Berg Balance Scale; TUG, Timed Up and Go Test; TCT, Trunk Control Test.

    p<0.05,

    p<0.01 by Pearson correlation coefficient analysis.

    Table 4. Comparison of ultrasonographic trunk muscle parameters between the high- and low-risk fall groups classified according to Berg Balance Scale

    Values are presented as mean±standard deviation.

    Value of NPS thickness and PS thickness was measured on resting state.

    NPS, non-paretic side; PS, paretic side.

    p<0.05,

    p<0.01 by Mann-Whitney U-test.

    TOP