

INTRODUCTION
One of the most significant sequelae of stroke is motor weakness, with over 50% of affected patients experiencing a residual motor deficit [1]. The corticospinal tract (CST) plays an important role in motor performance [2,3]. Damage to the motor cortex or descending motor pathways due to stroke results in Wallerian degeneration of the CST, which could compromise its integrity. Two methods are commonly used to evaluate the integrity of the CST: diffusion tensor tractography (DTT) and motor evoked potentials (MEPs).
Diffusion tensor imaging (DTI) yields clues about microstructural tissue properties by providing information on the direction and degree of water diffusion [4,5]. DTT, a recently developed technique derived from DTI, allows visualization of the CST through 3-dimensional reconstruction. Fractional anisotropy (FA) and fiber number (FN) of the CST reconstructed by DTT are widely used parameters that could be used to evaluate the integrity of the tract [6,7,8].
MEPs obtained through transcranial magnetic stimulation can be used as an electrophysiological tool for the evaluation of CST integrity [9]. MEP responsiveness and its parameters such as resting motor threshold (RMT), MEP latency, and central motor conduction time (CMCT) are widely used. Notably, CMCT, defined as conduction time from the motor cortex to the spinal motor neurons, is reportedly less affected by height, age, and peripheral nervous system diseases than is MEP latency [10].
In previous studies, the presence of CST in DTT and the responsiveness of MEPs in transcranial magnetic stimulation were used to calculate their sensitivity, specificity, positive predictive value (PPV), and negative predictive value (NPV) [11,12]. The clinical significance of DTT parameters and MEPs for estimating clinical status has recently been established [10,13,14,15]. To the best of our knowledge, no trial to date has calculated the sensitivity, specificity, PPV, or NPV of both parameters. Using these parameters, this study aimed to compare DTT and MEPs in estimation of clinical status in patients in the subacute stage of stroke. Further, it aimed to identify correlations between clinical status and parameters of the 2 modalities.
MATERIALS AND METHODS
Subjects
We recruited stroke survivors who were admitted to our rehabilitation ward between May 2012 and April 2015 through a retrospective chart review. The diagnosis of stroke was determined using brain diffusion-weighted magnetic resonance imaging (MRI) or computed tomography. Inclusion criteria were as follows: 1) first-ever stroke, 2) hemiplegic motor weakness, and 3) no serious medical complications such as pneumonia. For MRI safety, patients with any implanted metal (e.g., artificial pacemaker) were excluded. Clinical assessments, DTT, and MEPs were evaluated as soon as the patient was admitted to the rehabilitation ward.
Clinical assessments
The motor assessments used were the Medical Research Council (MRC) grading system (MRC, 0–5) and Fugl-Meyer Assessment (FMA). Functional assessments were performed using the Korean version of the Modified Barthel Index (MBI). Upper limb muscle strength was evaluated by testing for shoulder elevation and abduction, and elbow, wrist, and finger flexion and extension; a summed score (MRC upper limb assessment [MRC-U], 0–40) was then calculated [16]. The motor subscore of the FMA is a validated measure with a score ranging from 0–66 points for the upper extremity (FMA-U) and 0–14 for the hand subscore (FMA-H), which has been widely used because of its reliability and validity in stroke survivors [17,18,19]. Patients were classified into Good and Poor groups to calculate sensitivity, specificity, PPV, and NPV. The Good group included patients with mild weakness (FMA-U≥50) [20,21] and mild dependency in activities of daily living (MBI≥50) [22]; the Poor group included patients with severe weakness (FMA-U<50) and severe dependency in activities of daily living (MBI<50).
Diffusion tensor tractography
DTI was performed using a 3.0-T Philips MRI scanner with a synergy-L Sensitivity Encoding (SENSE) head coil with a single-shot spin echo-planar imaging (EPI) sequence. Routine imaging sequences included 3-dimensional fluid-attenuated inversion recovery imaging and diffusion-weighted imaging (b values of 0 and 1,000 s/mm2) with additionally calculated apparent diffusion coefficient maps. The technical parameters employed in DTI were as follows: data acquisition matrix, 120×120; field of view, 240×240 mm; echo time, 85 ms; repetition time, 8,590 ms; 70 slices; slice thickness, 2.25 mm; EPI factor, 67; and b-value, 1,000 s/mm2. Data processing was performed using the Fiber Track workstation (Philips Healthcare, Best, The Netherlands). Three regions of interest were drawn on a 2-dimensional FA color map: medulla, middle anterior pons, and posterior limb of the internal capsule. The final tracts of interest were determined as fiber tracts passing through the 3 regions of interest. The FA values of the final tracts were calculated automatically. FA and FN ratios were defined as the FA or FN of the affected CST divided by the FA or FN of the unaffected CST. Fiber tracking was terminated when the FA was <0.2 and the angle change was >45°, in accordance with a previous study on the optimal trackability threshold [23].
In our scanner, eddy currents are greatly reduced during acquisition because the magnet and gradient system characteristics related to eddy currents were carefully measured at the time of installation. Based on these measurements, the gradient waveforms are modified to minimize the effects of the eddy currents. In addition, in some sequences, we used additional pre-emphasis gradients to further reduce eddy currents. A diffusion registration package was utilized to correct for the remaining eddy currents using the Fiber Track workstation.
Patients were divided into subgroups according to the presence of the CST reconstructed by DTT, FA value, and FA ratio (rFA). First, the DTT presence group included patients with a preserved CST in the affected hemisphere, and the DTT absence group contained patients whose CST was interrupted or not constructed. Second, the FA normal group included patients with FA values ≥0.453, and the FA abnormal group included patients with FA values < 0.453 or 'not obtained' [14]. Third, patients with rFA ≥0.875 were included in the rFA normal group, and patients with rFA < 0.875 were included in rFA abnormal group [15].
Motor evoked potentials
A magnetic stimulator (Magstim, Carmarthenshire, UK) and circular coil (7 mm) were used. MEPs were recorded from both abductor pollicis brevis muscles in a relaxed state, and both hemispheres were examined. Electromyography (EMG) signals of the abductor pollicis brevis muscles were recorded and amplified using the Viking EMG System (Nicolet Biomedical, Madison, WI, USA). The threshold intensity required to generate peak-to-peak MEP amplitudes of ≥50 µV in 5 of 10 trials was defined as the RMT [24]. Stimulation intensity was set at 120% of the RMT, and the shortest latency of the MEPs was adopted. CMCT was calculated from MEP latency, M wave latency, and F wave latency [25]: CMCT=MEP latency–[1/2×(M wave latency+F wave latency–1 ms)]. The ratios of RMT, MEP latency, and CMCT, which were defined by dividing the affected value by the unaffected value, were calculated. When CMCT was >7.9 ms, it was defined as prolonged CMCT as in previous studies [26,27].
Patients were classified into subgroups. First, the MEP presence group was defined as patients with MEPs on the affected side, and the MEP absence group was defined as patients without MEPs on the affected side. Second, the CMCT normal group included patients with normal CMCT on the affected side (≤7.9 ms), and the CMCT abnormal group included patients with prolonged CMCT (>7.9 ms) or absence of MEPs on the affected side.
Statistical analyses
Statistical analyses were performed using SPSS ver. 18.0 software (SPSS Inc., Chicago, IL, USA). Independent t-tests were used to identify differences in clinical assessments between the subgroups. Pearson correlation analysis was used to identify correlations between clinical assessments and parameters of DTT and MEPs. A p-value less than 0.05 was considered statistically significant.
RESULTS
Demographics and clinical data
Fifty-five patients were included in this study. Demographic and clinical data are shown in Table 1. Eighteen patients (32.7%) experienced hemorrhagic stroke, and the remainder (67.3%) experienced ischemic stroke. The average age of the patients was 62.1±14.1 years, and the average interval from stroke onset to evaluation was as follows: DTT, 22.9±8.6 days; MEP, 24.9±11.7 days; clinical assessments, 22.3±8.9 days. Fifty patients (90.9%) had risk factors that included diabetes mellitus (23 patients, 41.8%), hypertension (29 patients, 52.7%), atrial fibrillation (8 patients, 14.5%), cigarette smoking (25 patients, 45.5%), and dyslipidemia (25 patients, 45.5%).
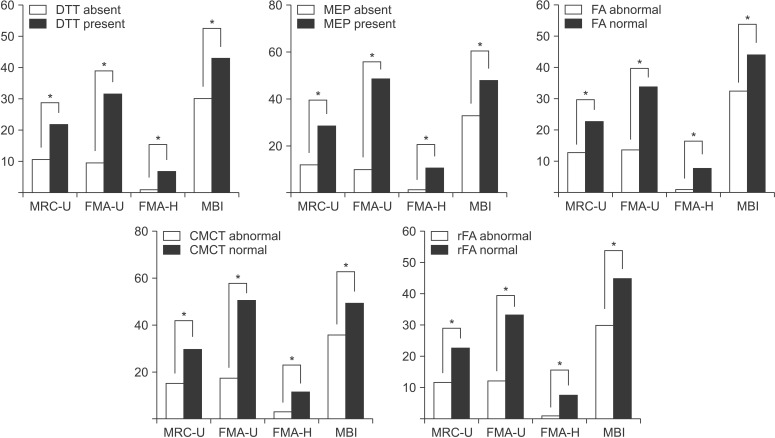
Comparisons of clinical status between subgroups
Fig. 1 shows a comparison of clinical assessments between subgroups. All clinical assessment values of the DTT present, FA normal, rFA normal, MEP present, and CMCT normal groups were significantly higher than those of the DTT absent, FA abnormal, rFA abnormal, MEP absent, and CMCT abnormal groups. The CMCT abnormal group included all the patients of the MEP absent group (35 patients) and those who had delayed CMCT with the presence of MEPs (9 patients). Among the 9 patients who showed delayed CMCT with the presence of MEPs, 6 patients had good motor status and the other 3 patients showed poor motor status.
Sensitivity, specificity, PPV, and NPV among subgroups
The sensitivity, specificity, PPV, and NPV values within each subgroup are shown in Table 2. Regarding FMA-U, MEP showed the highest sensitivity (1.00) and NPV (1.00) and the second highest specificity (0.85) and PPV (0.70). CMCT had the highest specificity (0.93) and PPV (0.73). Regarding MBI, FA had the highest sensitivity (0.75) and NPV (0.89), whereas CMCT had the highest specificity (0.84) and PPV (0.36). DTT presence showed the same sensitivity as FA, but its specificity, PPV, and NPV were lower than that of FA.
Correlations of parameters of DTT and MEP with clinical assessments
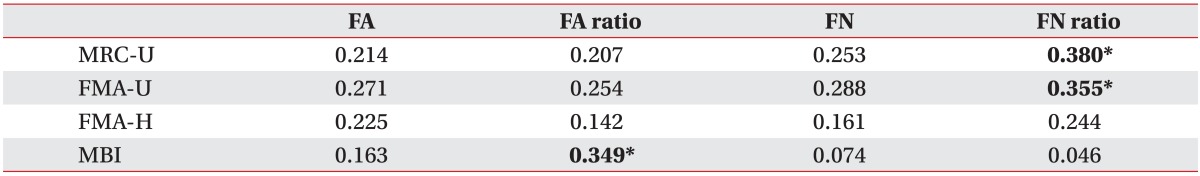
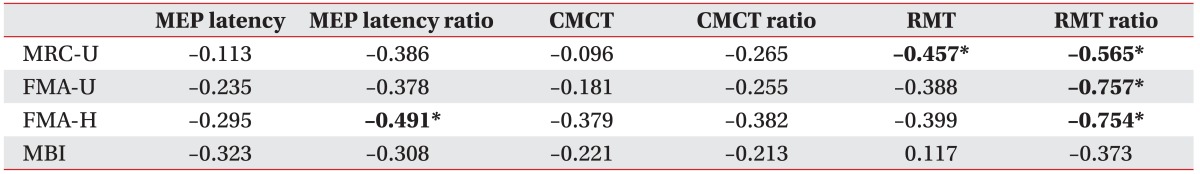
Among the DTT parameters (Table 3), the rFA weakly correlated with MBI scores (r=0.349, p=0.03) and the FN ratio weakly correlated with MRC-U and FMA-U (r=0.380, p=0.02; r=0.355, p=0.03). From analysis of correlations between MEP parameters and clinical assessments (Table 4), the MEP latency ratio showed a moderate negative correlation with FMA-H (r=–0.491, p=0.03), RMT revealed a moderate negative correlation with MRC-U (r=–0.457, p=0.04), and the RMT ratio showed strong negative correlations with MRC-U, FMA-U, and FMA-H (r=–0.565, p=0.009; r=–0.757, p<0.001; r=–0.754, p<0.001). However, none of the MEP parameters were significantly correlated with MBI scores.
DISCUSSION
In the current study, we evaluated the sensitivity, specificity, PPV, and NPV of DTT and MEPs in relation to estimation of clinical status in patients in the subacute stage of stroke. Regarding motor status of the upper limb, MEPs had the highest sensitivity and NPV, and the second highest specificity and PPV. CMCT showed the highest specificity and PPV in motor assessments, but had relatively low sensitivity and NPV. When considering all the statistics (sensitivity, specificity, PPV, and NPV), we conclude that MEPs were superior to the other parameters for the evaluation of motor status of the upper limb. However, FA had the highest sensitivity and NPV, and CMCT showed the highest specificity and PPV for estimating functional status. According to correlation analysis, the RMT ratio was strongly correlated with all motor assessments of the upper limb, while MEP parameters were not associated with MBI.
Few studies have combined DTT findings and MEPs for use in the evaluation of stroke. The studies by Jang et al. [11] and Kwon et al. [12] suggested that MEPs had high specificity and PPV, and that DTT showed high sensitivity and NPV. Our study demonstrated that MEP had the highest specificity and the second highest PPV. Although the sensitivity and NPV values of DTT were slightly lower than the corresponding values for MEPs (1.00 and 1.00), a relatively high sensitivity (0.93) and NPV (0.95) were observed for DTT, in agreement with the results of previous studies. However, MEPs scored relatively high in sensitivity, specificity, PPV, and NPV in comparison with other parameters. We conclude that MEPs are superior to the other parameters in assessing motor status of the upper limb. In contrast with previous studies that used only MEP presence and DTT findings, we used additional parameters such as FA and CMCT for calculating sensitivity, specificity, NPV, and PPV. Moreover, this study included comparisons of DTT and MEPs in terms of functional assessment (MBI), which was not addressed previously. With respect to functional assessment, FA had the highest sensitivity and NPV, and CMCT had the highest specificity and PPV. Therefore, FA and CMCT could be complementary parameters for the estimation of functional status.
Of note, this study was the first trial to use CMCT combined with DTT and MEPs. It has been reported that prolongation of CMCT is observed in the affected side of stroke survivors [28,29]. CMCT prolongation could be the result of several mechanisms. It may be caused by the recruitment of slow fibers or the need for temporal summation of cortico-motoneuronal volleys due to the loss of fast corticospinal fibers that are vulnerable to ischemic damage [29,30]. In a previous study, a strong negative correlation was observed between the severity of the neurological defect and MEP parameters such as CMCT [31]. However, no previous trials have used CMCT in combination with DTT and MEPs. Our study demonstrated that when comparing other parameters of DTT and MEPs, CMCT had relatively high specificity and NPV for estimating motor and functional status; thus, CMCT might be a helpful parameter in stroke evaluation.
Correlation analysis of MEP parameters and clinical assessments revealed that MEP latency ratio, RMT, and RMT ratio were significantly negatively correlated with upper limb motor assessments. In particular, RMT ratio was strongly correlated with all motor assessments. Indeed, RMT is a well-established measure of brain excitability. The decrease in excitability due to neuronal damage of the motor tract causes elevation of the motor threshold, and is also associated with motor weakness. In a previous study, it was reported that RMT was higher in the affected hemisphere than in the unaffected hemisphere of stroke survivors [32,33,34]. Similarly, our study demonstrates that the greater the motor weakness severity, the higher the RMT. RMT also showed a significant correlation with motor assessment (r=–0.457), which was, however, weaker than the RMT ratio correlation (r=–0.754). Ratios of MEP parameters seem more reliable than absolute values of these parameters because there is considerable inter-individual variability among healthy subjects [35]. However, MBI, a measure that estimates the degree of independence in activities of daily living, was not associated with any MEP parameters. The function of the upper extremity as well as the lower extremity plays an important role in MBI [36]. In this study, the MEPs might not have correlated with the MBI because the MEPs were used to evaluate the integrity of only the upper limb motor tract. Further study is needed to investigate this possibility.
Among the DTT parameters, rFA and FN ratio were partially correlated with upper limb motor and functional status. The FA value indicates the integrity of the CST, reflecting the directionality of molecular motion. Decreased FA values indicate interrupted integrity of the neural tract [4,5]. The FN was determined by the number of voxels contained within the CST, and it provided a quantitative estimate of the volume of intact fiber tracts [6]. Previous studies have demonstrated FA and FN ratios to show significant correlation with motor and functional status, which is in agreement with the conclusions drawn in our study [8,15,37]. The FN ratio correlated significantly with MRC-U and FMA-U (r=0.380 and 0.355, respectively), but the absolute values of the correlation coefficients were lower than those of the RMT ratio (r=–0.565 and –0.757). In contrast to MEPs, DTT is used to evaluate the CST of both the upper and lower limbs; thus, DTT was found to have a weak correlation with the upper limb.
One limitation of this study is the relatively small sample size. In particular, only 20 patients were analyzed for the correlation between MEP parameters and clinical assessments. Therefore, further studies involving larger sample sizes are necessary. Another limitation is that we did not consider factors such as decreased cognition and hemineglect that could have influenced the clinical assessments.
In conclusion, DTT and MEPs can be used as complementary modalities for the objective evaluation of upper limb motor and functional status during the subacute stage of stroke. The RMT ratio was the most helpful parameter for estimating motor status of the upper limb. However, further prospective studies in a large population are needed.