


INTRODUCTION
Assessment of an employee’s ability to engage in their work is a complex task, traditionally based on laws and the expertise of doctors [1,2]. Functional capacity evaluation is a standardized test that systematically assesses an individual’s physical ability to perform tasks and provides recommendations for occupational participation. It includes various activities such as graded material-handling activities (e.g., lifting, carrying, pushing, and pulling objects) and positional tolerance activities (e.g., sitting, standing, walking, balancing, reaching, stooping, kneeling, crouching, crawling, object handling/manipulation, fingering, hand grasping, and hand manipulation) [3]. Performance-based measures, particularly lifting tests, have shown strong predictive value in assessing occupational participation in individuals [4]. This type of evaluation can also serve as a prognostic tool for sick leave in physically demanding jobs [5].
In agriculture, evaluating workers’ physical work ability is crucial, given the high risk of musculoskeletal and related disorders [6,7]. Previous studies on farm workers have primarily focused on subjective assessments of work ability, relying on questionnaire such as the Work Ability Index questionnaire [8,9] and the Short Form-36 generic questionnaire [10]. It is a well-established health status measure utilized in general and occupational health surveys. However, it is important to note that participants may over-report their workload, leading to potential validity issues with these questionnaires. To address this limitation and obtain more accurate workload data there is a need for more objective approaches, including direct measurement of physical work capacity [11,12].
Evaluation of the physical work capacity of employee is necessary to identify any functional limitations, suggest goals for functional reinforcement training, and determine appropriate directions for specialized rehabilitation training. Additionally, determining the need for functional reinforcement training (rehabilitation) is crucial. However, it is important to selectively evaluate functional capacity evaluations related to agriculture. Understanding the specific burden in Korean agriculture such as squatting, repetitive wrist movements, shoulder flexion, trunk flexion or twisting, lifting, pushing, and pulling [13], can help determine an individual’s suitability for agricultural works.
Establishing the lower limit of normative values for functional capacity evaluation items may significantly contribute to research and practice [12]. This valuable information helps address the discrepancy that may arise between work demands and an individual’s ability to perform the required tasks. Comparing an individual’s physical capacity evaluation results with the lower limit of normative values for their physical demand category allows for more accurate suggestions for resuming work and establish rehabilitation goals [12].
In previous studies, the determination of normal values for functional capacity evaluation items has predominantly relied on the physical demand levels outlined in the Dictionary of Occupational Titles (DOT), which encompasses descriptions of the physical demands associated with a wide range of jobs [12]. Some studies have further classified occupations into five groups based on the physical demands indicated by the DOT: sedentary, light, medium, heavy, and very heavy. By obtaining normal values for functional capacity evaluation and predicting return to work based on these values, these studies have provided valuable insights [14,15]. However, to the best of our knowledge, there is a gap in research regarding the specific normal values of functional capacity evaluation items for occupational groups, particularly in the agricultural sector.
Thus, our objective is to bridge this gap by providing the lower limit of normative values for evaluating the physical work capacity required for common farming works. We aim to present essential data on the functional range of healthy working individuals and shed light on the systematic management of occupational musculoskeletal diseases prevalent among farmers. Additionally, we plan to investigate the relationship between physical work capacity, specifically as it pertains to common farm tasks, and trunk body composition. By focusing on these aspects, our study seeks to contribute to a more comprehensive understanding of the physical work capacity required for the agricultural field.
METHODS
Participants
The study included healthy 124 volunteers, aged between 20 and 79 years, who had no prior or current involvement in agricultural labor. Prior to participation, all individuals provided written informed consent. Certain exclusion criteria were established to ensure the integrity of the study results. Participants with medical conditions that required treatment and could potentially impact the measurements of physical work capacity were excluded. Likewise, individuals who had previously undergone spinal surgery or were currently experiencing back pain were excluded due to their potential influence on measurements related to the back. Participants with systolic blood pressure exceeding 160 mmHg or diastolic blood pressure exceeding 100 mmHg were excluded as their elevated blood pressure could affect strength measurements. To explore trunk body composition, participants who had undergone an abdominal computed tomography (CT) scan within the past 6 months, which could result in radiation exposure, were excluded. Moreover, pregnant individuals or those suspected to be pregnant were excluded from the study.
Prior to physical work capacity measurements, the weights and heights of the participants were measured, and their body mass indices (BMIs) were calculated. In the standing posture, the heights of the eyes, elbows, and waist (at the level of the anterior superior iliac crest) were also measured. The research protocol received approval from the Institutional Review Board (IRB) of Kangwon National University Hospital (IRB No. 2016-03-009), ensuring compliance with ethical standards.
Items of physical work capacity measurement
In a previous study [13], a survey was administered to 1,001 Korean farmers using the Korean version of the 20-item Agricultural Work-related Ergonomic Risk Questionnaire. This questionnaire aimed to evaluate the frequencies of 20 actions associated with ergonomic risks in agricultural work. Respondents rated the frequency of each action on a scale ranging from “never” to “always.” Common farm tasks were defined as those with a frequency of “frequently” or “always” responses exceeding 30%. The study identified several common farm tasks based on the questionnaire responses. These tasks included squatting, highly repetitive wrist movements, shoulder flexion, trunk flexion or twisting, constant stress on the finger or wrist, neck flexion or extension, repetitive elbow flexion and extension, shoulder flexion, lifting heavy objects, and pulling and pushing with excessive force. These identified tasks formed the basis for the measurements presented in Table 1.
The measurements conducted in this study included assessments of grip strength, trunk range of motion (trunk flexion and extension angles), static strength (trunk flexion/extension, lifting, pushing, and pulling strengths), and positional tolerance tests. The positional tolerance tests involved tasks such as squatting, reaching forward, twisting, and upward reaching, and the test time for these tasks was recorded (Table 1). In determining the lower limit of normative values for physical work capacity scores in clinical practice, we defined the normal range based on mean±standard deviation [16,17].
Hand grip strength
Participants were seated with their shoulders adducted and neutrally rotated (i.e., at an angle of 0°), elbows flexed at 90°, and forearms and wrists in neutral positions, according to the American Society of Hand Therapists’ recommendations for testing grip strength (Fig. 1A) [18]. Hand grip strength was measured first in the left hand and then in the right using a hydraulic hand dynamometer (SH5001®, Saehan Corporation). This type of dynamometer has five different handle positions, and the recommended choice for evaluating grip strength is the second handle position, where the handle bars are set on the second notch (Fig. 1B) [18]. The maximum value for each measurement was in kilograms. The average of the three grip force values for each hand was obtained. We also analyzed the association between the dominant hand grip strength and trunk body composition.
Range of trunk flexion and extension
The range of motion during forward flexion and backward extension of the trunk was measured using a digital inclinometer (Dualer IQ ProTM Digital Inclinometer; JTECH Medical). The measurements were recorded in degrees. The method employed for measuring lumbar flexion and extension followed the inclinometer technique recommended by the Cocchiarella et al. [19].
To measure the trunk range of motion, a primary sensor was placed at the T12 level, while a secondary sensor was positioned over S1 in the sagittal plane to measure the angle (Fig. 2). To locate the T12 spinous process, the initial step involved identifying the highest point of the iliac crest and then moving horizontally towards the midline direction to locate the L4 spinous process. Continuing upwards from L4, the T12 spinous process was successfully located. To find the S1 spinous process, the posterior superior iliac spine was located, and then a horizontal movement towards the midline direction helped locate the S2 spinous process. By sequentially moving upwards from S2, the S1 spinous process was identified.
The trunk flexion range was determined by instructing the participants to stand and bend their trunks as much as possible without moving their legs or hip joints. The trunk extension range was obtained while the participants stood and maximally extended their trunks. Each measurement was performed three times, and the average value was calculated to obtain the final measurement.
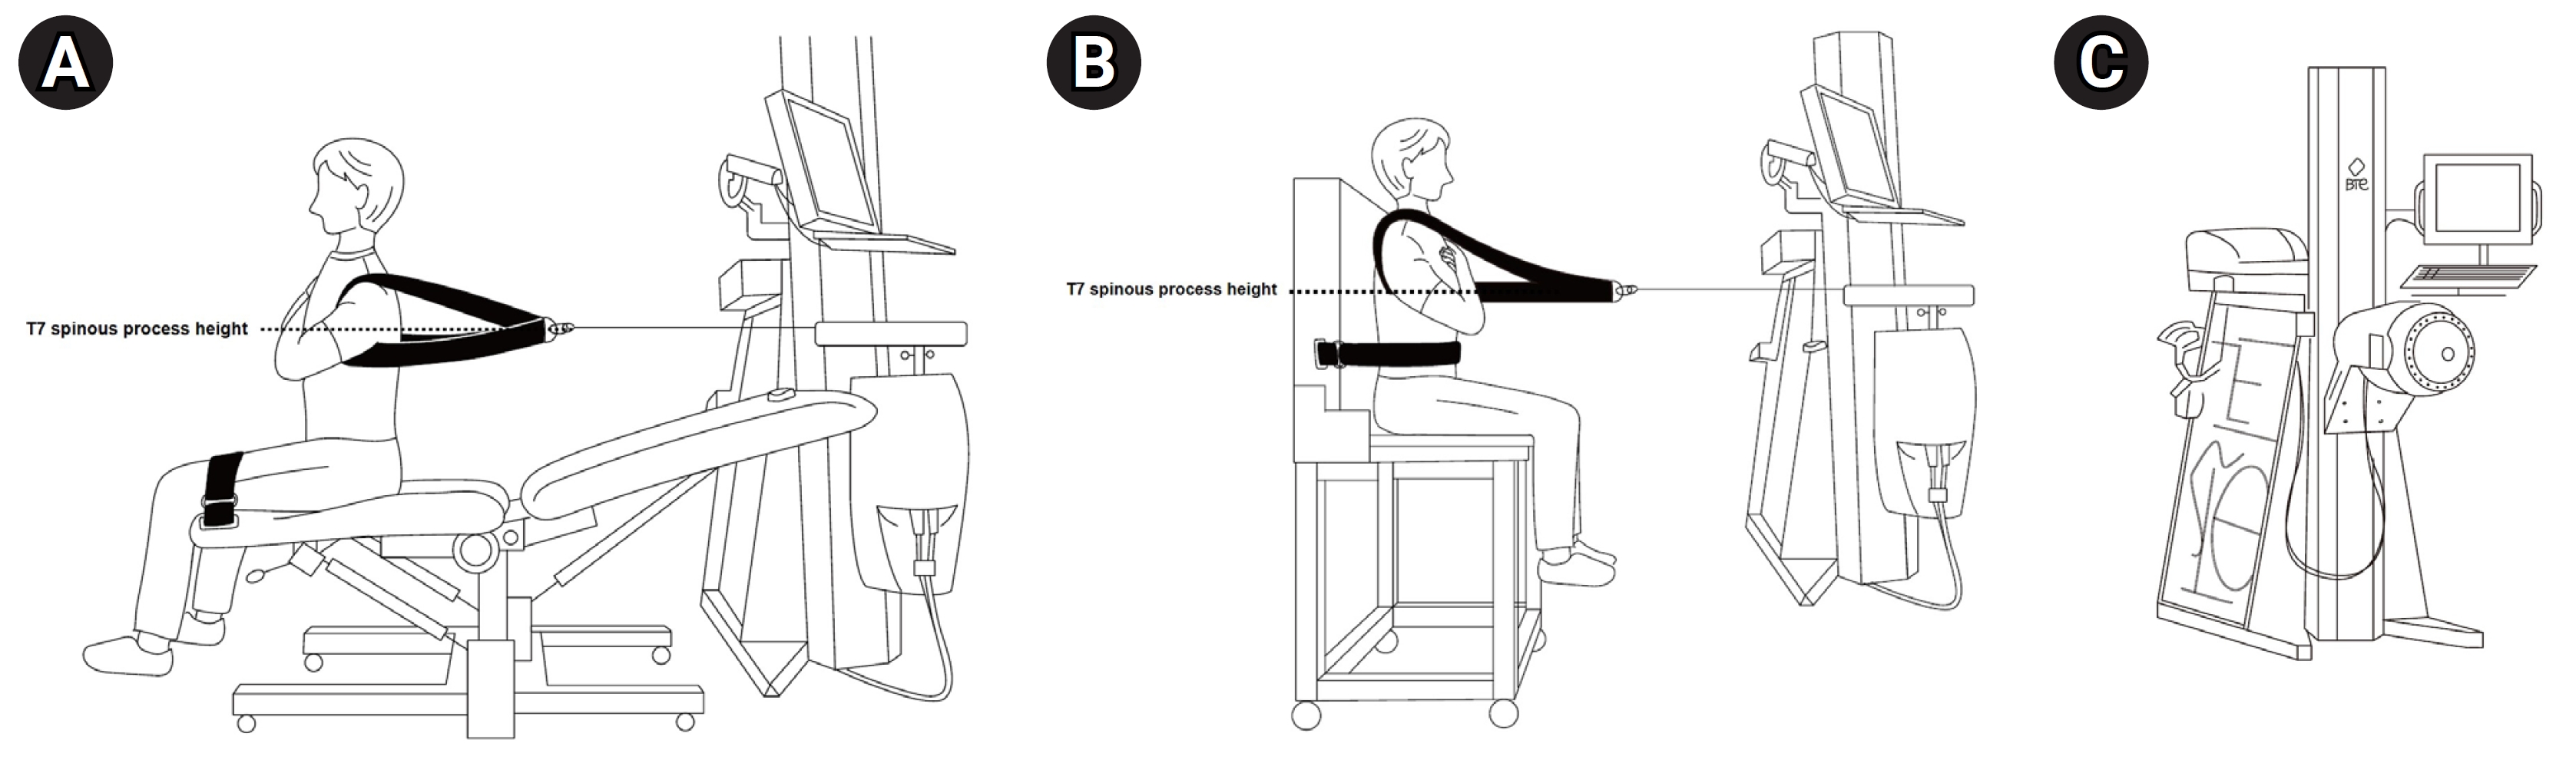
Trunk flexion and trunk extension strengths
To measure static isometric trunk flexion and extension strengths, a physical performance evaluation instrument called PrimusRS (BTE Technologies Inc.) was utilized. The PrimusRS is an isokinetic dynamometer that can assess muscle forces in isometric, isotonic, and isokinetic modes. It has a maximum recording capacity of up to 1,800 lbs. (816 kg) of isometric force.
For the measurement, the height of the anchoring cable was adjusted to the T7 spinous process level, and participants were seated in a chair (Fig. 3) [20]. Measuring strength in a sitting position was intended to evaluate pure trunk strength and minimize power transmission from the legs by ensuring that the legs did not touch the ground as much as possible [20].
To accurately identify the T7 spinous process, initial reference points such as the C7 spinous process (vertebra prominens of the neck) were located during the gross anatomy examination. Using this reference, the T1 spinous process was identified, and subsequently, the T7 spinous process was located. To ensure the accuracy of identification, cross-verification was performed using an alternative method. According to gross anatomy, the T7 spinous process aligns with the inferior angle of the scapula. Hence, the initially identified T7 process was compared with this expected location to confirm their correspondence.
During the strength measurements, participants were instructed to fold their arms across their chests and keep their shoulders relaxed. Trunk flexion strength was measured by instructing participants to perform isometric flexion of their trunks. Trunk extension strength was measured by instructing participants to push the square back plate of the instrument as far as possible for a duration of 3 seconds. This measurement procedure was repeated five times, and the mean value was calculated using only the median values, excluding the maximum and minimum values of the five trials.
Leg lifting and back lifting strengths
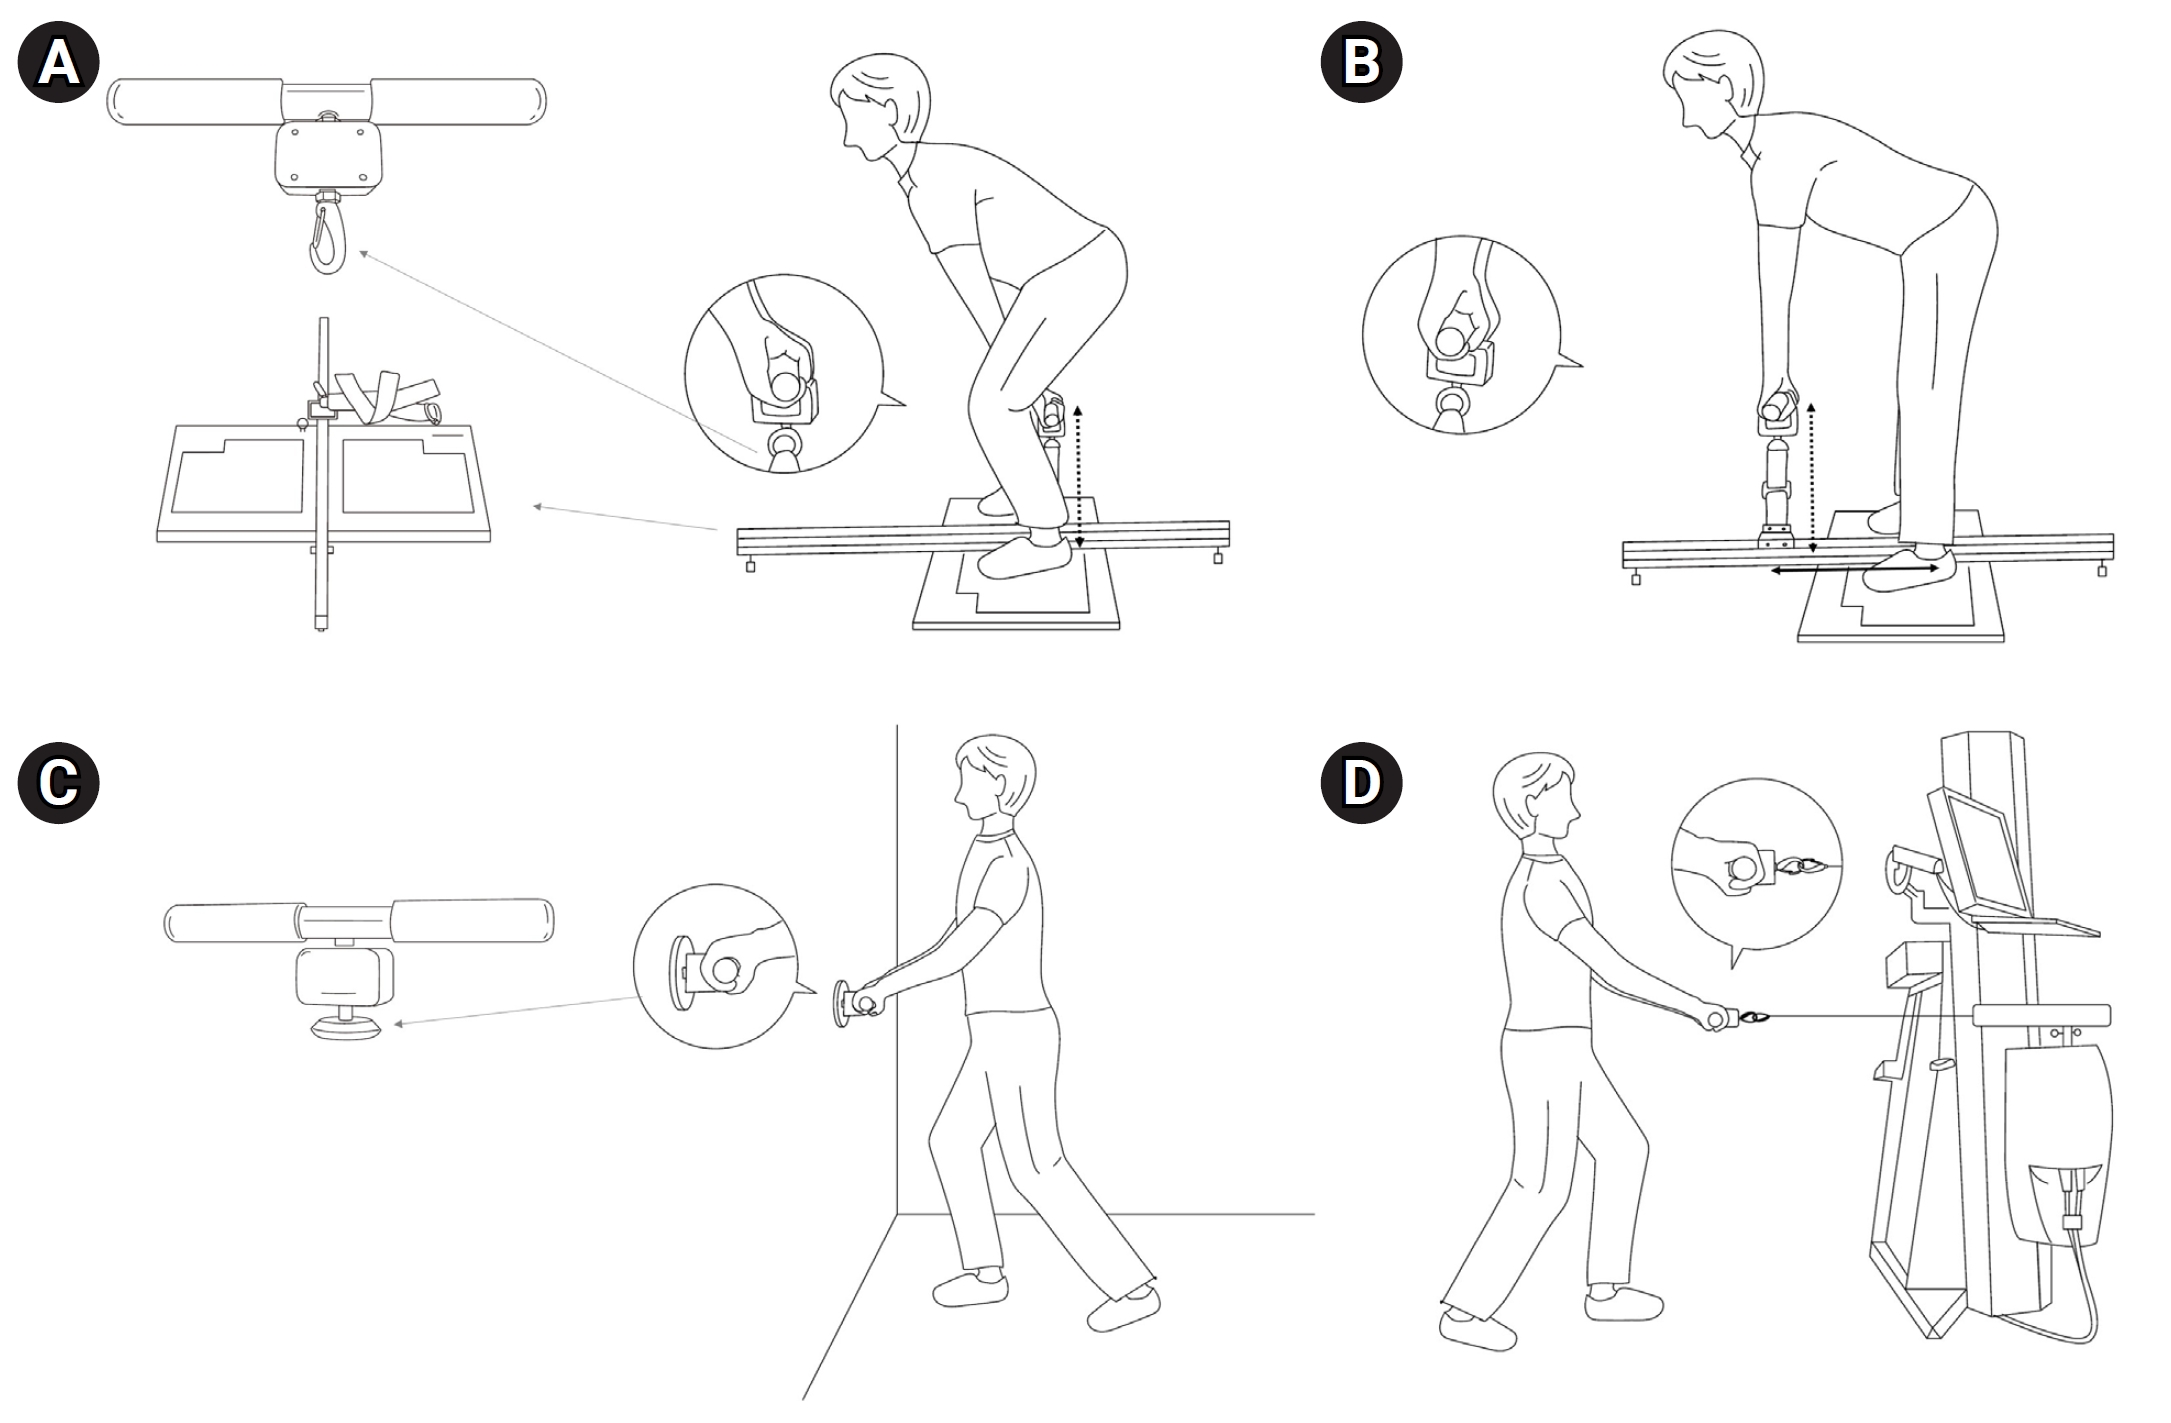
The evaluation of lifting strength involved two postures: leg lifting and back lifting. Leg lifting, also known as the squat technique, is the recommended lifting technique where the knees are flexed while keeping the back as upright as possible. On the other hand, back lifting, also known as the stoop technique, is a posture where the individual bends forward from the waist, which is considered more strenuous on the lower back.
Isometric lifting strength was measured using a platform called Mobile Lift System (JTECH Medical) in two different horizontal and vertical adjustments. A static force gauge dynamometer (Commander Echo; JTECH Medical) was used for the measurements. The horizontal adjustment refers to the horizontal distance between the midpoint of the hand grasp and the midpoint of the ankle, while the vertical adjustment refers to the vertical distance between the midpoint of the hand grasp and the floor.
In the evaluation of both leg lifting and back lifting, the vertical adjustment was fixed at 15 inches (38.1 cm) (Fig. 4A, B). This vertical distance was maintained consistently for measuring the lifting strength in both postures.
Regarding the horizontal adjustment, there was a distinction between leg lifting and back lifting. For leg lifting, the horizontal adjustment was set at 0 cm, indicating that the midpoint of the hand grasp and the midpoint of the ankle were aligned along the same vertical line.
On the other hand, for back lifting, the horizontal adjustment was set at 38.1 cm. This means that the midpoint of the hand grasp was positioned 38.1 cm horizontally away from the midpoint of the ankle (Fig. 4B). This setting allowed for the assessment of lifting strength specifically in the back lifting posture.
Each measurement was performed three times, and the average value was calculated to obtain a reliable representation of the individual’s isometric lifting strength in each posture.
Pushing and pulling strengths
To assess the pushing and pulling strengths, the height of the handle was adjusted to align with the level of the anterior superior iliac spine, as depicted in Fig. 4. The handle was connected to a wireless digital static force gauge dynamometer (JTECH Commander Echo).
Participants were instructed to perform maximal isometric pulling and pushing exercises while standing. For the pushing strength measurement, participants faced a wall and exerted force on the dynamometer, as shown in Fig. 4C. On the other hand, for the pulling strength measurement, the force gauge was connected to the PrimusRS machine, not for utilizing the PrimusRS force gauge but for stabilizing the wireless force gauge during the pulling technique (Fig. 4D).
Measurements were conducted three times for each participant, and the average value was calculated to obtain an accurate representation of their pushing and pulling strengths.
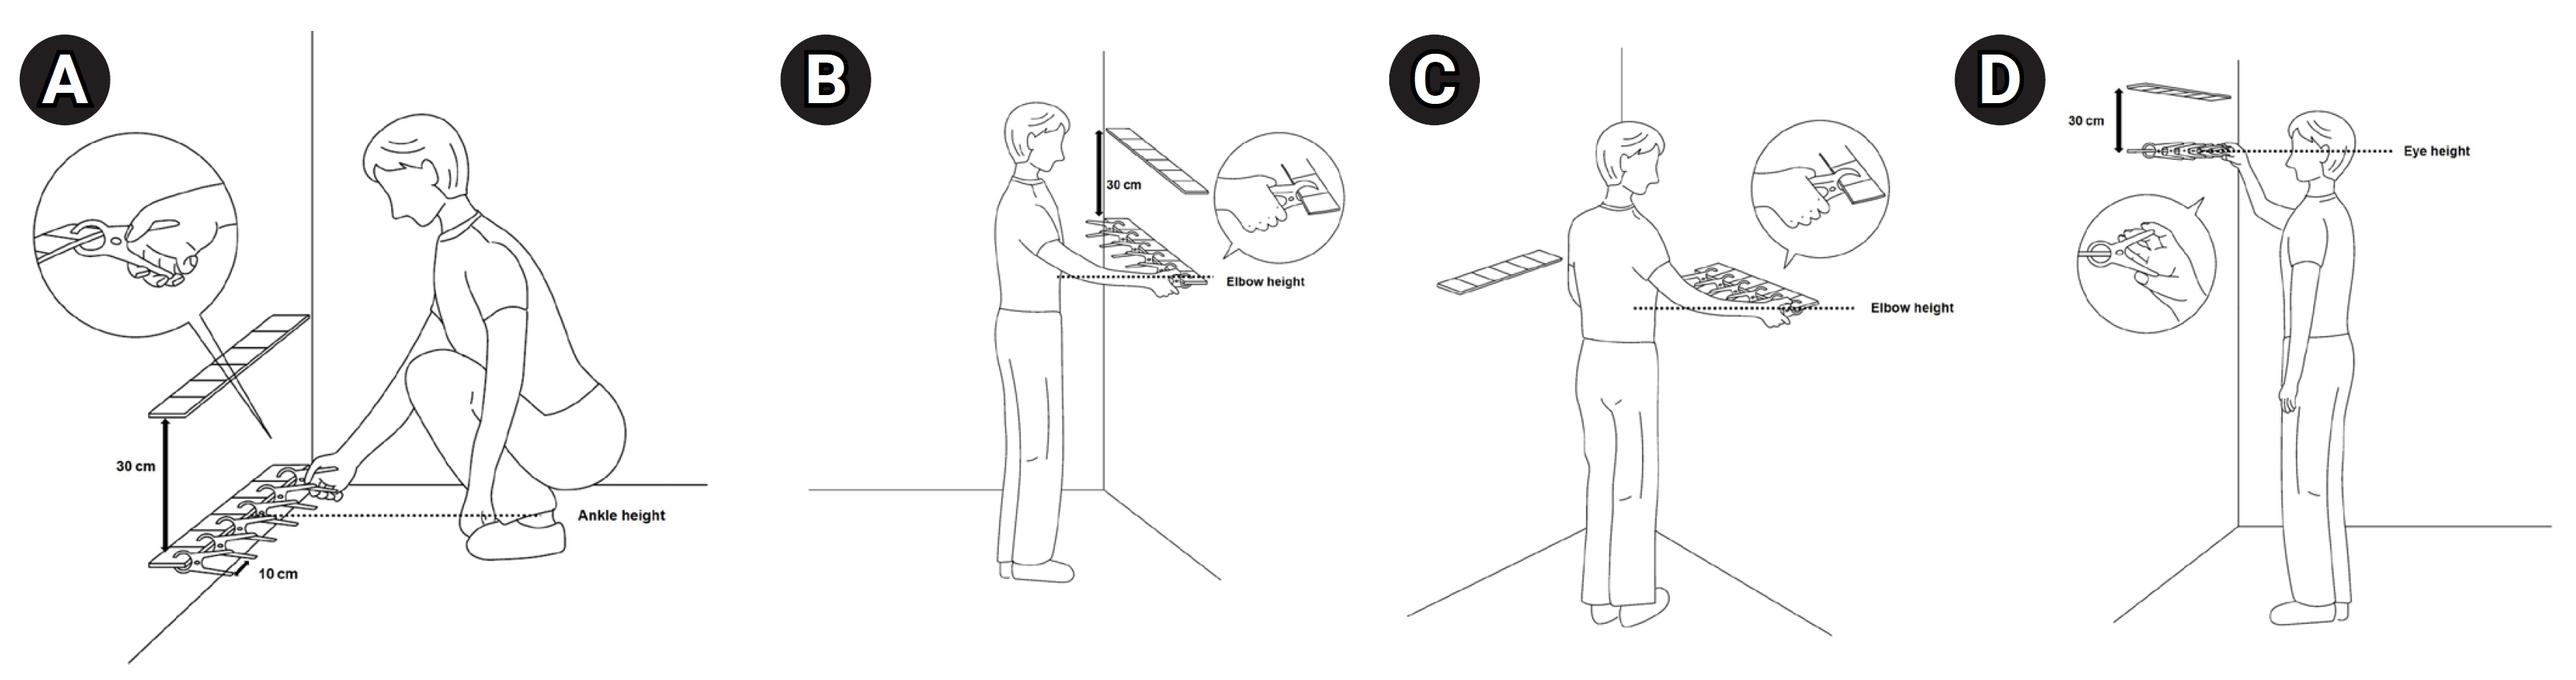
Positional tolerance of squat, front, twist, and upward reaching tasks
The positional tolerance test included four types of tasks of manipulating the clothespin in different positions as quickly as possible. The front, twist, and upward tasks were performed in the standing position, whereas the squat task was performed in the squatting position (Fig. 5). Initially, a set of six clothespins was arranged horizontally positioned, each spaced 10 cm apart from its neighboring clothespin. The starting task height was adjusted differently depending on the specific task being performed: the malleolus level for the squat task (Fig. 5A), the elbow level for the front and twist tasks (Fig. 5B, C), and the eye level for the upward reaching task (Fig. 5D). For each task, participants were instructed to sequentially move and then return the clothespins to their original positions, repeating this process five times. Among these tasks, three required moving the clothespins upward by 30 cm from their initial position (squat, front, and upward tasks), while the twisting task required shifting them horizontally by 90°. The clothespin was gripped with the thumb, index finger, and middle finger of the participant’s dominant hand. During the squat, front, and twisting tasks, the thumb was placed on the top, with the index and middle fingers located at the bottom. Conversely, during the upward task, the thumb was placed at the bottom, while the index and middle fingers were situated on top.
Test-retest reliability
We analyzed the reliability of the protocols used to determine their reproducibility [21]. All physical work capacity items were re-measured 2 weeks after the first evaluation. Precision measurements, which are usually performed in test-retest studies, are necessary [22]. Classifying the reliability of a protocol involves statistical analysis using indices such as the intraclass correlation coefficient (ICC), which is widely used for this type of analysis [23,24]. This enables the categorization of these measures into indicators relevant to clinical practice [25].
For the isometric trunk extension strength in a seated posture, the test-retest reliability was reported as an ICC of 0.82 with a 95% confidence interval of 0.65 to 0.91 [20]. This indicates a high level of agreement between repeated measurements of isometric trunk extension strength. A mean-rating (k=3), absolute-agreement, two-way mixed-effects model was used for strength measurements to calculate ICC estimates and their 95% confidence intervals, except for trunk extension strength measurement [25]. A single-rating (k=1), absolute-agreement, two-way mixed-effects model was used for the working speed results [25].
A 95% confidence interval of the ICC estimate was used to determine the reliability level. Values<0.5 indicated poor reliability, between 0.5 and 0.75 indicated moderate reliability, between 0.75 and 0.9 indicated good reliability, and >0.90 indicated excellent reliability.
Trunk body composition
To analyze trunk body composition, the participants underwent CT scans at the mid-L4 vertebral level using a Philips MX 8000 IDT CT scanner (Philips Medical Systems), with a tube voltage of 120 kV, exposure of 200 mAs, and slice thickness of 1 mm. Images were taken from ten consecutive 1-mm-thick slices (total thickness: 10 mm). Participants maintained their hips in a neutral position during the scan to prevent any effects of hip flexion on the measurement of the cross-sectional area of the muscle. Total muscle mass (TMM, cm3) and total fat mass (TFM, cm3) were automatically derived from predefined radiation attenuation ranges using image processing software (Extended Brilliance Workspace version 4.5.3, Philips Healthcare Nederland B.V.). Manual outlining was used to subdivide the TMM into psoas muscle mass (PMM, cm3) and back muscle mass (BMM, cm3), and abdominal muscle mass (AMM, cm3) was calculated by subtracting the PMM and BMM from the TMM. The BMM included the multifidus, iliocostalis lumborum, longissimus, and quadratus lumborum. Visceral fat mass (VFM, cm3) was determined by manually tracing the inner abdominal wall using TFM. Subcutaneous fat mass (cm3) was calculated by subtracting the VFM from the TFM. The trunk fat/muscle ratio was calculated by dividing the TFM by the TMM. The scans and image processing were performed by one technician [26].
Statistical analysis
To compare the anthropometric characteristics and trunk body compositions between sex groups, the chi-squared test or independent t-test was employed. This allowed for the examination of any significant differences in variables such as height, weight, BMI, and trunk fat/muscle composition between male and female.
The range of trunk flexion and extension, as well as strength measurements including grip strength, trunk flexion, trunk extension, lifting, pushing, and pulling, were compared between male and female using independent t-tests. Furthermore, within each sex group, the range of trunk motion, strength measurements, and positional tolerance times were compared among the three age groups using Welch’s one-way ANOVA. Post-hoc analysis was performed using the Games–Howell method to determine specific differences between age groups.
Paired t-tests were employed to compare paired variables. This included comparisons of trunk flexion and extension, leg and back lifting strengths, as well as pushing and pulling strengths.
To investigate the association between trunk body composition and physical work capacity evaluation items, such as the range of trunk flexion and extension angles, strength measurements, and positional tolerance times, correlation coefficients were computed. These correlation coefficients quantify the magnitude and direction of the relationship between these variables. By calculating and analyzing the correlation coefficients, the study aimed to assess the extent to which trunk body composition relates to various physical work capacity evaluation items. This information can contribute to a better understanding of the influence of trunk body composition on physical work capacity and performance in tasks related to agricultural work.
RESULTS
Anthropometric characteristics of participants
A total of 124 healthy volunteers participated in this study, including 55 male and 69 female: 60 (48.4%) aged 20–39 years, 51 (41.1%) aged 40–59 years, and 13 (10.5%) aged 60–79 years. Age did not significantly differ between male and female. The mean BMI of the participants was 23.7±3.4 kg/m2, with a mean height of 165.4±9.3 cm and a mean weight of 63.9±12.3 kg. The heights of the eye level, waist level, elbow level, and ankle level were 155.4±8.8, 92.8±5.8, 106.7±6.0, and 8.7±1.0 cm, respectively, in the standing posture. All other height values were significantly higher in male than in female, except for the ankle height. Male had significantly higher values of VFM, TMM, BMM, PMM, and AMM than female (p<0.05; Table 2).
Items of physical work capacity measurement
Dominant hand grip strength
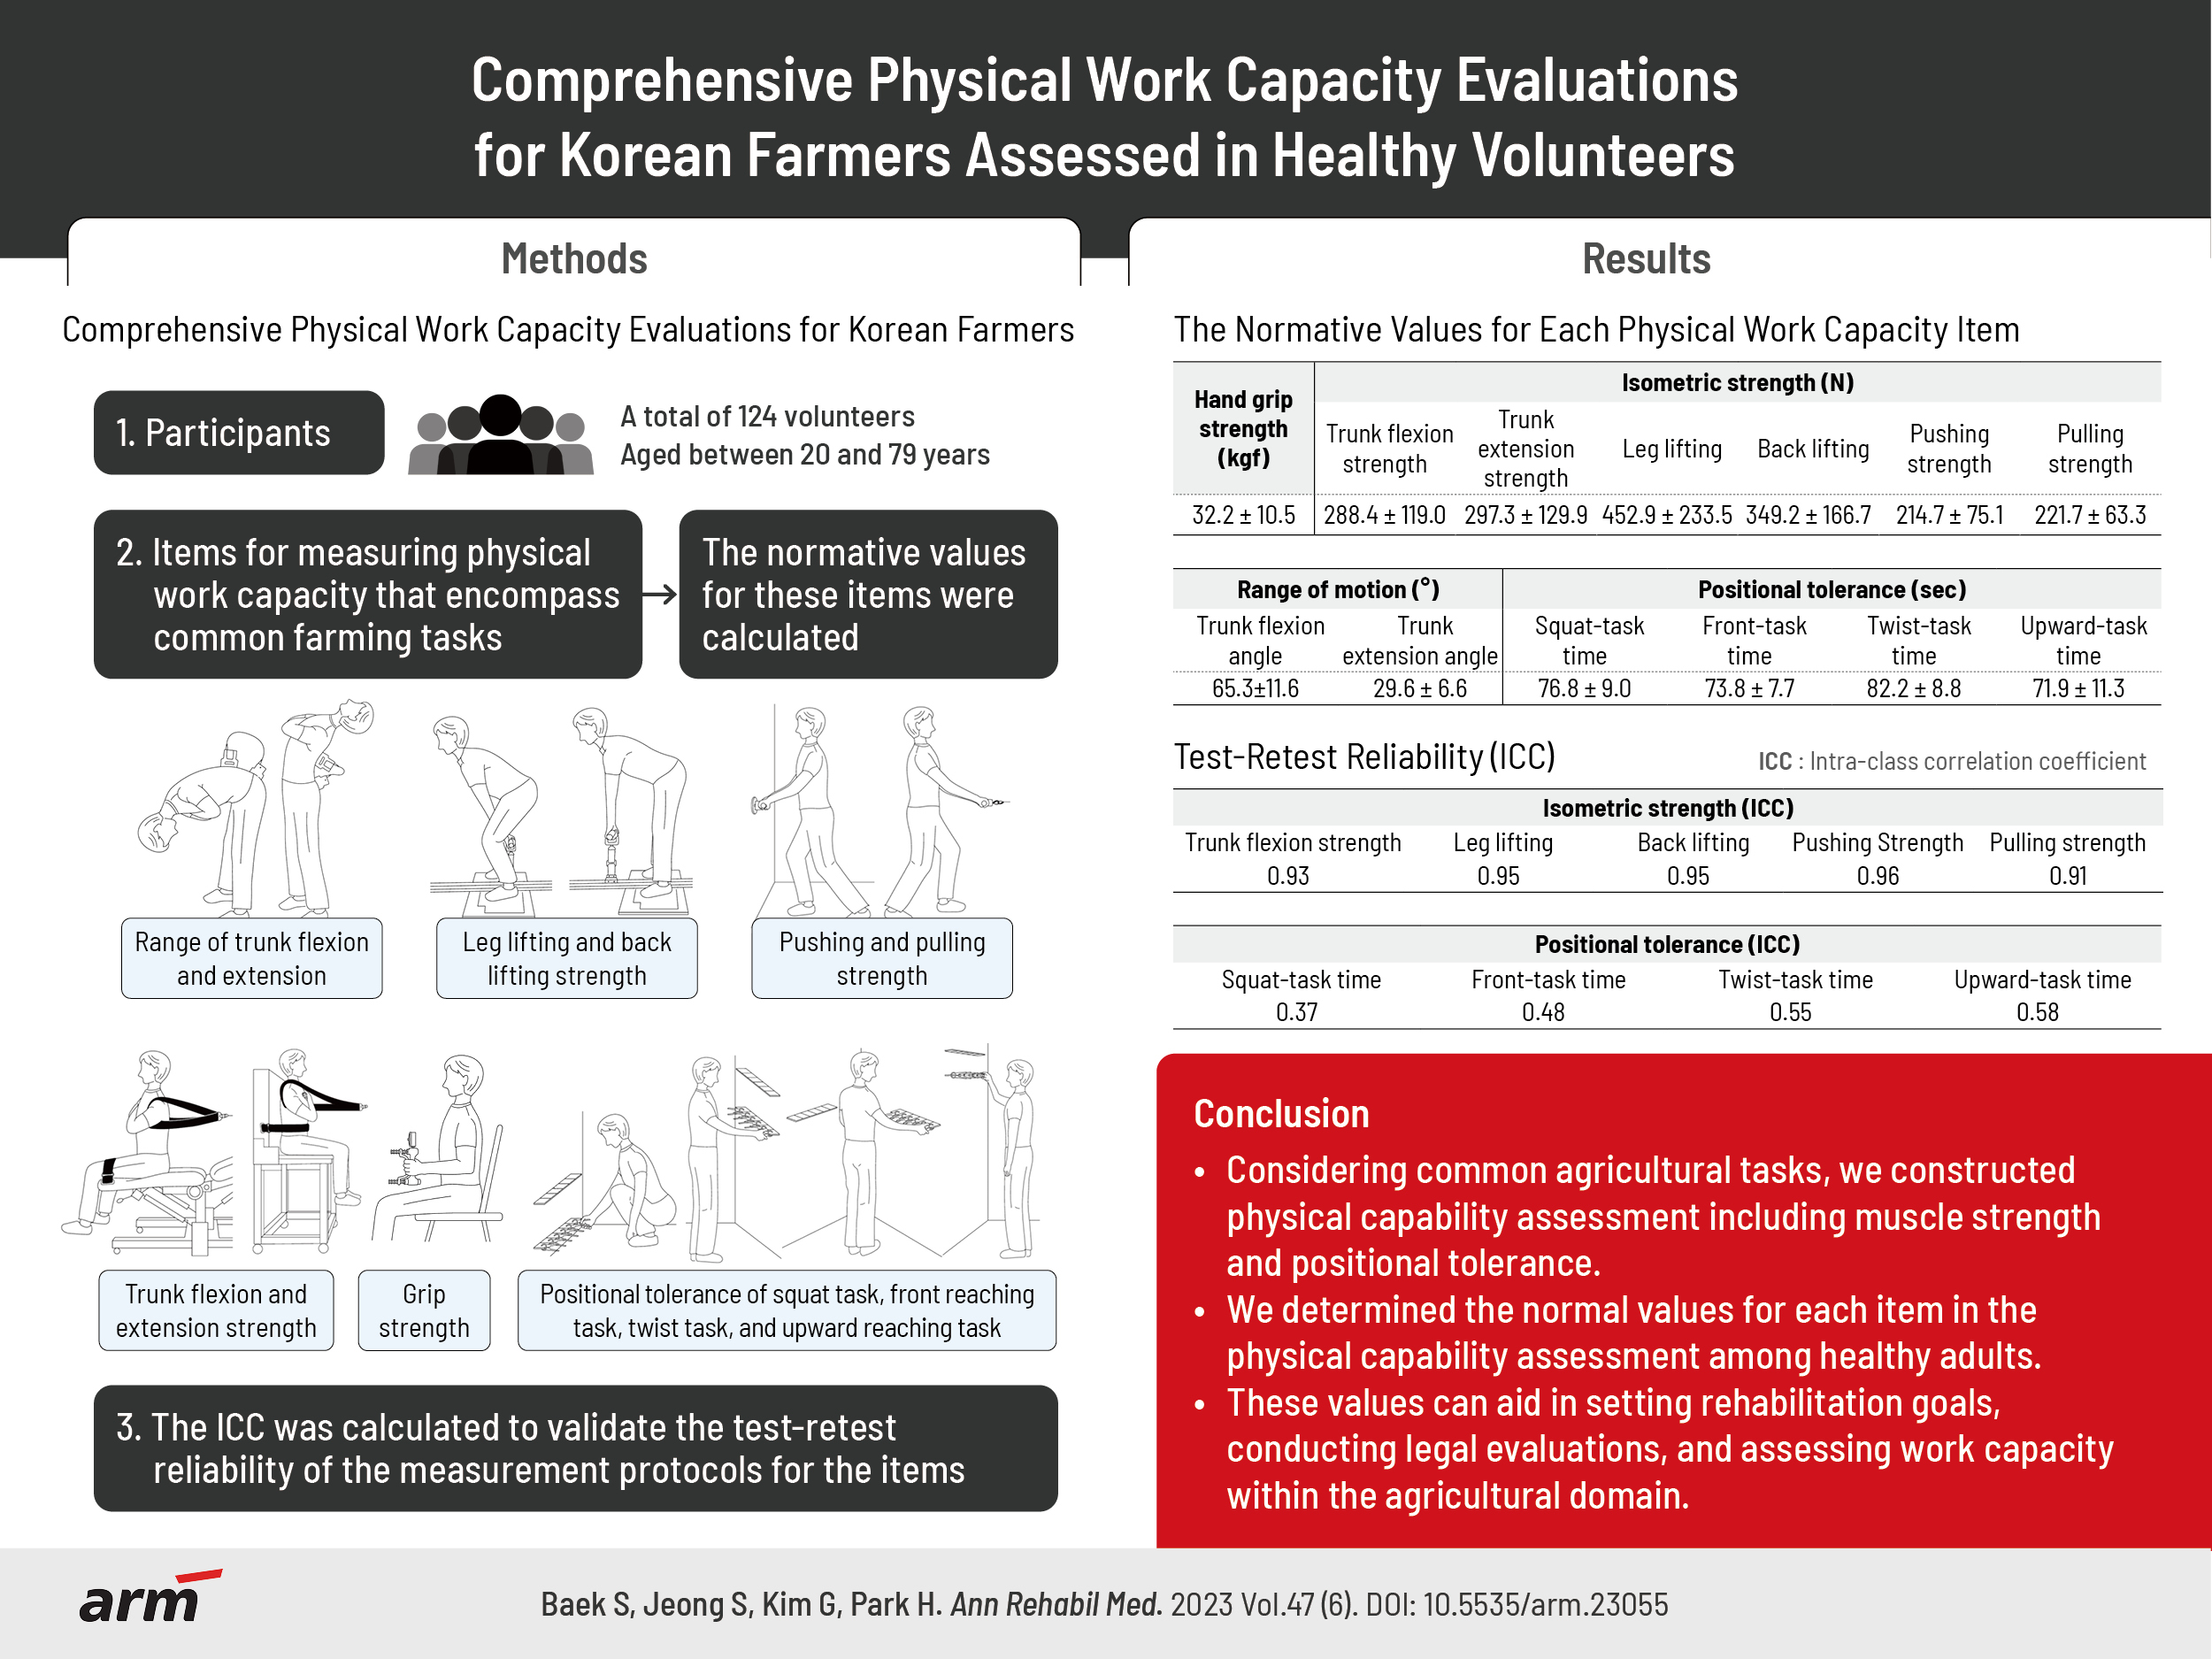
The average grip strength of the dominant hand for all participants was 32.2±10.5 kgf. In male, the strength was 42.1±7.1 kgf, which was significantly higher than that in female (24.3±4.2 kgf) (p<0.01). Grip strength tended to decrease in the oldest group among female (Table 3).
Range of trunk flexion and extension
The ranges of trunk flexion and extension were 65.3°±11.6° and 29.6°±6.6°, respectively, and there were no significant differences between male and female (p=0.70). Trunk flexion and extension ranges showed a significant tendency to decrease with age (p<0.05; Table 3).
Trunk flexion and trunk extension strengths
Trunk flexion and extension strengths were 288.4±119.0 and 297.3±129.9 N, respectively, and were not significantly different using a paired t-test (p=0.18). Both trunk flexion and extension strengths significantly differed between males and females (males: 390.1±98.6 and 385.9±130.5 N, females: 207.3±53.6 and 226.6±74.6 N, respectively; p<0.01). Trunk flexion and extension strengths did not show significant differences between age groups among male, whereas trunk extension strengths in the older groups were weaker than those in the youngest group among female (p<0.05; Table 3).
Leg lifting and back lifting strengths
The strength of leg lifting was 452.9±233.5 N, which was significantly higher than the strength of back lifting (349.2±166.7 N) using a paired t-test (p<0.01). Leg and back lifting strengths showed significant differences between male and female (p<0.01): 659.0±185.0 and 467.0±176.0 N in male and 288.7±98.7 and 255.3±74.0 N in female for leg and back lifting, respectively. However, there was no significant difference in lifting strength according to age among male and female (Table 3).
Pushing and pulling strengths
The pushing and pulling strengths were 214.7±75.1 N and 221.7±63.3 N, respectively. These strengths were not significantly different using a paired t-test (p=0.11). However, pushing and pulling isometric strengths significantly differed between male and female (p<0.01): 276.3±57.2 N and 264.9±59.8 N in male and 165.6±45.8 N and 187.3±41.3 N in female for pushing and pulling, respectively. Moreover, only the pushing strength tended to decrease with age in male and female (p<0.05; Table 3).
Positional tolerance time
The shortest upward-task time was 71.9±11.3 seconds, followed by front-task (73.8±7.7 seconds) and squat-task (76.8±9.0 seconds) times. The longest time was required for the twist task (82.2±8.8 seconds). There were no significant differences in positional tolerance results between male and female. Positional tolerance did not differ according to age in any of the four positions among male. However, the stand and twist tasks required a longer time in the 60–79 years age group than in the 40–59 years age group among female.
Test-retest reliability
Table 4 shows the ICC for the test-retest reliability. Strength measurements of trunk flexion, pulling, pushing, leg lifting, and back lifting showed excellent test-retest reliability. In contrast, the positional tolerance test showed poorer test-retest reliability than strength measurements. The squat and front tasks, in particular, showed poor reliability, whereas the twist and upward tasks showed moderate reliability.
Association with trunk body composition
Table 5 presents the correlation coefficients between the physical work capacity evaluations and anthropometric factors. The findings indicate the following associations:
• Dominant hand grip strength, trunk flexor and extensor strengths, and trunk flexion and extension angles were positively correlated with TMM in both male and female.
• Leg lifting strength did not show a significant relationship with TMM in both sex.
• Trunk flexion and extension angles were negatively correlated with trunk fat in both male and female.
• Back lifting, pushing, and pulling strengths exhibited positive correlations with factors such as body weight and BMI.
• In male, the time taken to complete the squat, stand, twist, and upward tasks did not show significant associations with body weight and BMI.
• In female, the time required for the squat, stand, twist, and upward tasks increased as BMI, TFM, and VFM increased.
These results shed light on the relationships between physical work capacity evaluations and anthropometric factors, providing valuable insights into the physical work capacities and body composition of the participants.
DISCUSSION
Our study emphasizes the importance of assessing the physical work capacity of Korean farmers to perform their duties. We examined tasks commonly performed by Korean farmers, including squatting, repetitive wrist movements, shoulder flexion, trunk flexion or twisting, lifting, pushing, and pulling. The evaluation measures included trunk flexion and extension angles, hand grip strength, trunk flexion and extension strengths, lifting strength in two postures, pushing and pulling strengths, and positional tolerance in four working postures. This evaluation provides basic data on the lower limit of normative values of physical work capacity evaluation items in agricultural work. All strength measurements showed excellent agreement in terms of test-retest reliability. However, the completion time was shorter during the retest for positional tolerance, and the absolute agreement of the test-retest was poor to moderate.
Our results showed that physical work capacity tends to decrease with age among female. Dominant hand grip strength, range of trunk flexion and extension, trunk extension strength, and pushing strength tended to decrease with age. Interestingly, dominant hand grip strength and trunk extension decreased in female but not in male. Furthermore, female in the old age group took longer to complete some of the positional tolerance tests than those in the young age group. On the other hand, in male, the older group did not take longer than the younger group to complete some postural tolerance tests. This result is consistent with that of a previous study on Finnish farmers’ self-reported morbidity and physical work capacity [27]. This study revealed that female farmers face higher risks in terms of physical work capacity with increasing age. This may be explained by female having relatively lower muscle strength than male, which reduces their physical work capacity to perform agricultural tasks.
The test-retest reliability of all strength measurements showed excellent agreement, aligning with findings from a previous systematic review [28]. This review, which evaluated 32 studies on strength assessment [28], encompassing both excellent and moderately methodological quality, demonstrated that strength assessment displays good-to-excellent test-retest reliability. This holds true regardless of factors such as participants’ history of resistance training, sex, and age. Furthermore, other high-quality evidence supports the reliability of trunk strength assessment in the seated position. The position is the most reliable protocol for isometric assessment in healthy individuals and individuals with nonspecific non-specific low back pain, for which no anatomical cause can be found [29]. These results are consistent with the findings of this study. Strength measurement is accurate since it is performed through constant mechanical action.
In contrast, the retest for positional tolerance showed poor-to-moderate absolute agreement and a shorter completion time. The low test-retest reliability of time measurement in “positional tasks” is due to its inherent variability. Participants may perform the task slightly differently each time, reducing consistency in time measurement. Moreover, a learning effect in which individuals become more skilled at the task during retesting may occur, resulting in a shorter completion time.
The measured physical strength parameters showed a significant relationship with trunk body composition. First, body weight and BMI exhibited a positive correlation with back lifting, pushing, and pulling strength for both male and female and trunk flexion strength in female. This association seems intuitive, suggesting that strength could naturally increase with higher body mass. Second, trunk muscle mass showed significant relationship with most of strength results except for male leg lifting strength. For male, leg lifting strength might be associated other unmeasured muscle mass, such as leg muscle. Third, there were interesting relationship between fat mass, along with BMI, and strength. These positive correlations were particularly apparent in back lifting and pulling strength in male and trunk flexion, pulling and pushing strength in female. This is in accordance with the study of Hulens et al. [30], which studied differences in muscle strength of lean versus obese female. Their research unveiled that obese female with elevated BMI and fat mass demonstrated greater trunk strength when compared to their lean counterparts [30]. This is consistent with that obesity could reasonably possess increased muscle power to mobilize their heavier bodies during exercise [31].
The composition of the trunk body was also found to have a connection with the results of positional tolerance tests. Specifically, the amount of fat mass was associated with an increased in the time of positional tolerance, but this connection was observed only among female. These positional tolerance tests require individuals to maintain a specific posture, which in turn relies on the endurance of their muscles as they repeatedly contract to sustain the posture. This prolonged and repetitive muscle contraction is known as muscle endurance [32]. The proportion of fast-fatigue fibers within the skeletal muscles is elevated in obese individuals [33], which contributes to swift muscle fatigue and an inability to sustain muscle contraction over extended periods, ultimately resulting in decreased muscle endurance. Moreover, the percentage of body fat is a physical trait that tends to be higher in female compared to male, typically by around 10% [34]. This difference places female at a potential disadvantage, as they need to exert more effort in lifting or supporting unnecessary body mass during activities. Second, for the muscle mass, the larger muscle was related with shorter positional tolerance time in front-task in male and twist- and upward-task in female. These results suggest that reducing body fat while maintaining muscle mass may be beneficial for overall physical work capacity, which is consistent with a previous study [35,36]. Excess body fat can lead to a decreased physical work capacity [35], including difficulties with usual and narrow walk, chair stands, and standing balance [36], whereas maintaining or increasing muscle mass can improve it.
To provide more accurate recommendations for returning to work, Table 3 can be used by clinicians to compare a patient’s physical work capacity with that of healthy individuals. However, it’s important to note that all normative values should be chosen by clinicians regardless of sex or age. This is because the physical work capacity required for agricultural work must be sufficient to handle the relevant workload, regardless of age or sex [12]. Additionally, a study on the return to work of employees on long-term sick leave showed that one of the obstacles to return to work is that employees struggle to come to terms with their disabilities, and suboptimal thinking patterns and actions can impede the return to work journey [37]. Consequently, the physical work capacity evaluation results can validate their perception of their work capabilities and aid in establishing a course of action for return to work [38].
This study has several limitations that should be acknowledged. Firstly, the lower limit of normative values for physical work capacity evaluation may not capture the work capacity of experienced agricultural workers, as previous researches [38,39] suggest differences between novice and experienced workers. Further research focusing on experienced workers is needed. Secondly, the controlled setting of the physical work capacity evaluation may not fully represent the dynamic and unpredictable nature of actual agricultural work, warranting caution when applying normative values to real-world settings. Lastly, the generalizability of the study’s findings to Western agriculture is limited due to the study’s reliance on Korean data and the specificities of Korean agricultural practices. Further research considering Western contexts is necessary for broader applicability.
In future studies, it would be beneficial to investigate the concurrent validity between these normative values obtained in this study and results obtained from workplace assessments. This would provide further insight into the usefulness and applicability of the normative values in practical setting. Furthermore, it would be valuable to investigate the normative values of physical work capacity evaluation items in other occupational groups, such as those in forestry, fishing, mining, and manufacturing. This would expand the applicability of the normative values beyond the farming population and provide a more comprehensive understanding of physical demands in various occupational settings. In addition, future studies should continue to investigate the physical strength and positional tolerance required for various types of farming tasks to provide more detailed and specific normative values for farmers. This would enable more tailored assessments and interventions for individuals in this occupation.
In conclusion, this study establishes normative values for physical work capacity evaluation in agriculture, providing a valuable tool for evaluating workers’ suitability. These findings have implications for rehabilitation goals, legal assessments, and work capacity evaluations in the agricultural sector, enhancing accuracy and effectiveness.