


INTRODUCTION
Low back pain (LBP) is a very common musculoskeletal problem around the world and is known as a major health problem as it causes disability. In particular, Korea is a world’s leading aging country and the prevalence of LBP is on the rise with increasing personal and social costs, raising its importance [1].
Occupation is known as a factor that affects the prevalence of LBP [2]. Occupational groups with increased prevalence of LBP included construction and extraction workers, community and social service workers, health care practitioners, technician, farmer, fisher, and forestry [2]. Among all male workers’ occupations, health care practitioners had the highest risk for LBP, whereas among female and middle-aged (41–64 years) workers, farming, fishing, and forestry occupations had the highest risk [2]. It is reported motions causing LBP include lifting, pushing, pulling, standing, or walking for a long time [3,4].
Various clinical factors including sagittal spino-pelvic alignment and back muscle mass are known to be associated with LBP. A number of studies have been conducted on the association between LBP, sagittal spino-pelvic parameters. Previous studies found that parameters like sagittal vertical axis (SVA), lumbar lordosis (LL), sacral slope (SS), pelvic incidence (PI) and pelvic tilt (PT) were associated with prevalence of LBP [5,6].
There are studies that have investigated the relationship between the incidence of LBP and sagittal spino-pelvic parameters in certain occupational group. A study found that larger SVA and smaller LL were observed in Korean farmers compared to the general population, and there was a positive correlation between their working time and SVA [7]. Additionally, a study reported that sagittal spino-pelvic alignment was identified as a strong determinant of LBP and blue-collar occupation is associated with increased SVA and PT/PI ratio [8]. However, research on fishery workers is insufficient, although they are known to be vulnerable to LBP.
In addition to spino-pelvic alignment, recent studies have documented the relationship between LBP and back muscle strength, size and structures [9]. To evaluate back muscle mass, various tools were used such as dual-energy X-ray absorptiometry (DEXA), muscle cross-sectional area (CSA) and bioelectrical impedance analysis (BIA). Some studies found that erector spinae or multifidus CSA were smaller in LBP group, compared to normal group [10,11]. In contrast, there is a study which found no difference in average trunk muscle area according to LBP severity [12]. A study also reported the correlation between trunk muscle mass measured with BIA, Oswestry Disability Index (ODI) and EuroQol 5 Dimension (EQ5D) score [13].
The aim of this study is to investigate the relationship between LBP and sagittal spino-pelvic parameters along with the relationship between LBP and back muscle mass in Korean male and female fishery workers. Furthermore, we aimed to find out how this correlation differs from general population or other occupational group.
METHODS
Subjects
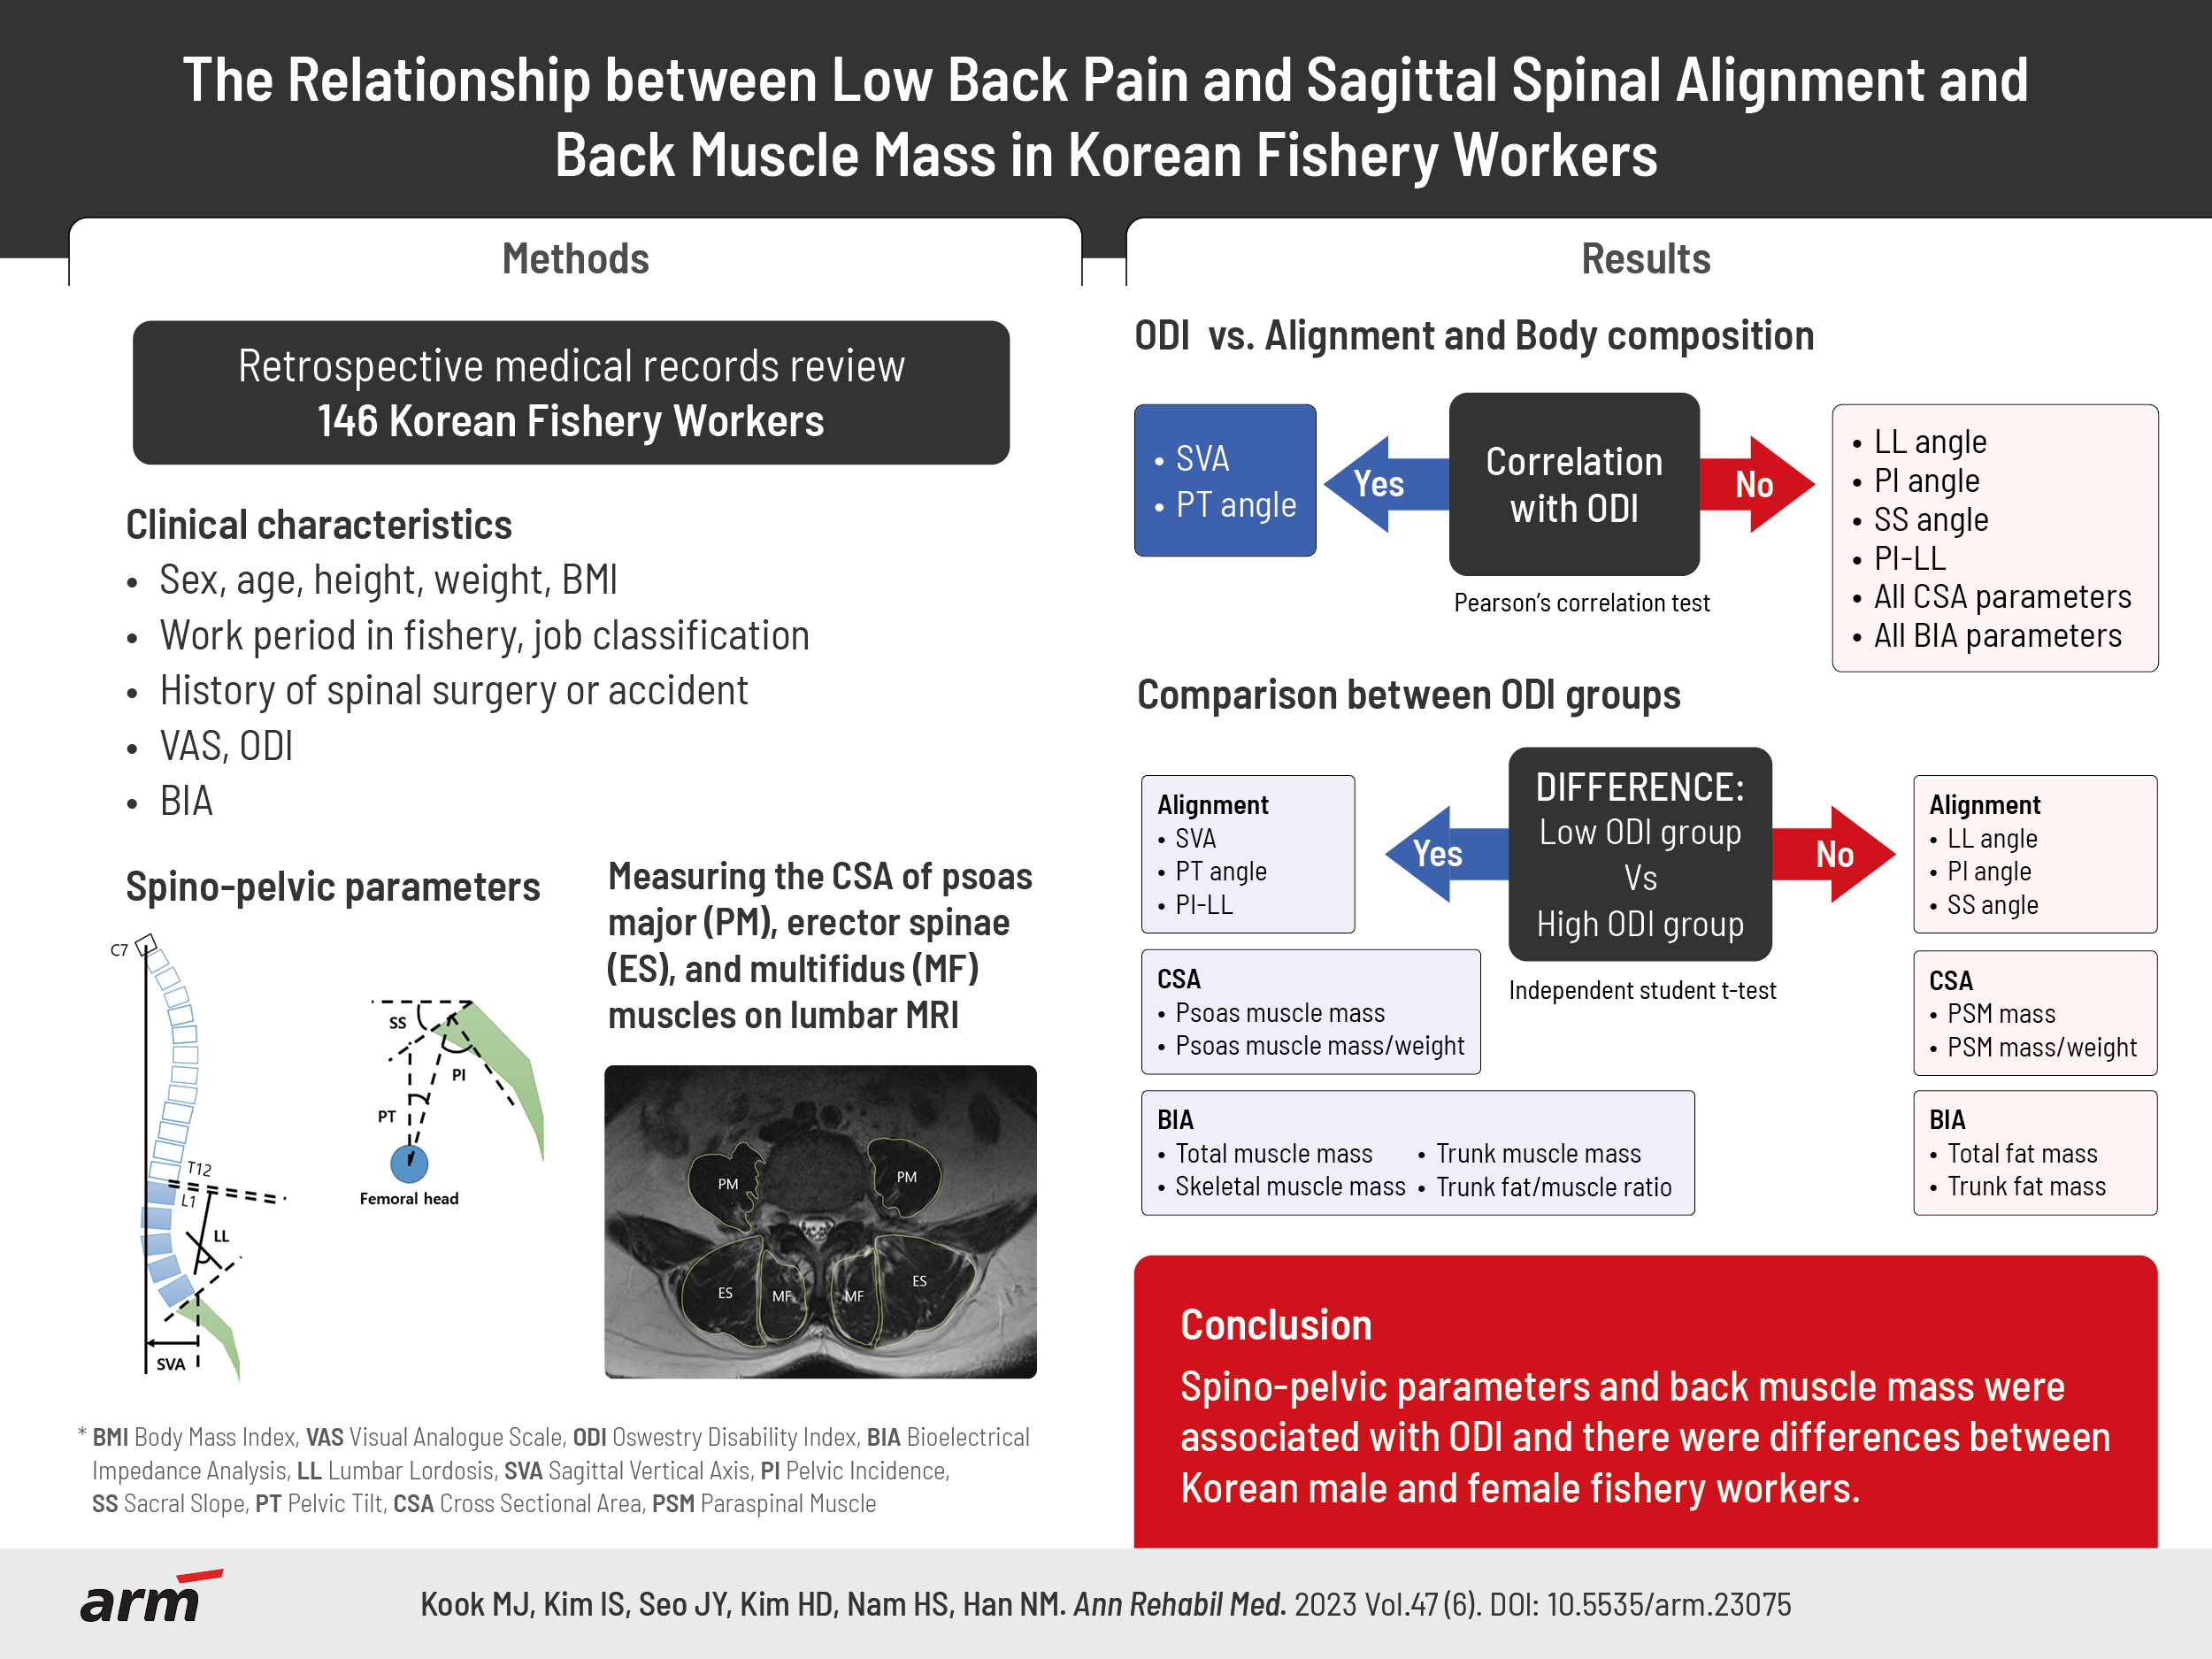
This retrospective study enrolled 387 subjects who went through fisher’s low back musculoskeletal disorder health survey conducted from June 2018 to August 2020 in Inje University Busan Paik Hospital Center for Fishermen’s Safety and Health funded by Ministry of Oceans and Fisheries Affairs of the Republic of Korea. Institutional Review Board (IRB) of Inje University Busan Paik Hospital had reviewed and approved this study and informed consent requirement was waived based on the retrospective nature of this study (IRB No. 2022-11-048). Inclusion criteria for the study were as follows: (1) age between 40 to 64, (2) active fisherman, and (3) engagement in fishery for a minimum of 3 consecutive years at the point of examination. The exclusion criteria were as follows: (1) previous history of spinal accident or spine surgery, (2) presence of spinal tumor or fracture, and (3) insufficient data of exam such as questionnaire, whole spine standing X-ray, lumbar spine magnetic resonance imaging (MRI) and BIA (Fig. 1). Finally, a total of 146 subjects were included for statistical analysis.
Demographic characteristics
Data were collected from questionnaires and medical records. Variables included sex, age, work period in fishery, job classification, history of spinal surgery or accident. Job classification were as follows: fishing fishery (trap gill net, long line), aquaculture (shellfish, fish, and seaweeds), diving fishery such as Haenyeo (Korean female sea divers) and others like oyster shucker. Regarding spinal disorders, we retrospectively collected the data from prior MRI readings by a musculoskeletal specialized radiologist.
LBP
LBP severity were investigated through data collected from a face-to-face questionnaire. LBP severity was assessed using visual analogue scale (VAS) and ODI.
The ODI is considered as the gold standard of LBP functional outcome measure [14]. The ODI questionnaire consists of 10 items (pain intensity, difficulty in managing personal care, lifting, walking, sitting, standing, sleeping, sex life, social life, and traveling). Each item scores from 0 (no pain or disability) to 5 (worst pain or complete disability). The item associated with sex life is recommended to be conducted only if applicable. In this study, except for that one item, the scores for the nine items were added together. Final score was reported as percent using the following formula: ODI=sum of item scores (0–45)/maximum score (45)×100. The subjects were divided into two groups based on the ODI score, with a cutoff of 20%. Less than 20 was categorized as the low ODI group, while 21 or higher was classified as the high ODI group.
Sagittal spino-pelvic parameters
Whole spine standing lateral X-ray images were reviewed. The following parameters were measured by 2 examiners on the whole spine standing X-ray. The SVA is defined as the distance between C7 plumb line and superior-posterior corner of sacrum. LL is defined as the angle between upper margin of the first lumbar vertebra and upper margin of sacrum. SS is defined as the angle between upper margin of sacrum and the horizontal line. PI is defined as the angle between perpendicular bisector line of upper margin of sacrum and the line connecting the center of femoral head and the midpoint of upper margin of sacrum. PT is defined as the angle between the vertical line and the line connecting the center of femoral head and the midpoint of upper margin of sacrum (Fig. 2). Then the average value of two examiners’ measurements was used to reduce the measurement error.
Muscle mass measurement
Muscle mass was assessed using data from two methods: BIA and CSA measured on lumbar MRI. BIA had been conducted using InBody 370S (InBody). Whole body measurements had been taken with the subject in a standing barefoot on the rear sole electrodes of device with the arms abducted from the trunk. Subjects had been asked to hold the hand electrode so that the 4 fingers wrap the surface of the bottom hand electrode, and place the thumb on the oval electrode. All subjects had been required to be examined in the morning on an empty stomach. All tests had been performed by one examiner. Total fat mass, total muscle mass and skeletal muscle mass had been obtained. In addition, trunk fat/muscle ratio had been calculated by dividing trunk fat mass by trunk muscle mass.
Lumbar spinal MRI images taken in supine neutral position were reviewed by 2 examiners fot CSA parameters. Gross CSA of psoas muscle and paraspinal muscle (PSM) were measured at the lower edge of L4 vertebral level. PSM consist of erector spinae and multifidus muscle (Fig. 3). Each muscle’s CSA was obtained by adding both side measurements for each subject. Then, the final value was obtained calculating the average of two examiners’ measurements.
Statistical analysis
To compare the difference of variables between male and female, independent t-test was performed. Independent student t-test was used for the comparison of sagittal spinal alignment, back muscle CSA, body composition between low ODI group, and high ODI group.
Correlation between ODI, spinal parameters and body composition mass were analyzed using Pearson’s correlation test. A p-value less than 0.05 was considered statistically significant. All statistics were analyzed using IBM SPSS version 23.0 (IBM Corp.).
RESULTS
Table 1 shows subject demographic characteristics and variables. Among all subjects, 75 (51.4%) were male and 71 (48.6%) were female. The average age was 58.33±4.98 years in male and 56.45±5.17 in female. Statistically significantly higher VAS, ODI score and greater PT, total fat mass, trunk fat mass, and trunk fat/muscle ratio were found in female compared to male. Male showed significantly higher age and larger PSM and psoas muscle mass, total muscle mass, skeletal muscle mass, and trunk muscle mass than female. There was a difference in the proportion of fishery type that female and male engaged in.
The prevalences of other spinal disorders are presented in Supplementary Table S1. The prevalence of at least one level of herniated intervertebral disc (HIVD) was found to be 19.18%, and the prevalence of advanced disc degeneration was 63.01%. In the case of facet joint degeneration (FJD), moderate degenerative disease was observed in 27.40% and severe degenerative disease was observed in 15.75% of subjects. When evaluating spondylolisthesis, 19.9% had mild spondylolisthesis.
Table 2 presents correlation between ODI, spino-pelvic parameters and body composition in male and female group. In female, positive correlation with ODI was found SVA (r=0.422, p<0.001) and PT (r=0.335, p=0.004). No statistically significant correlation was found in male. In both groups, no parameter measured by BIA showed statistically significant correlation with ODI. The ODI score did not correlate with any of muscle mass calculated by CSA on spine MRI.
DISCUSSION
Studies have been conducted on the relationship between spinal alignment, back muscle and LBP. In addition, sex differences have been noticed widely in the field of research about LBP and spine pathology. However, research on the relationship between LBP and spinal alignment has not been done for fishermen, although they are known to be highly exposed to working environment inducing LBP. This study is the first presented research that focused on a specific occupational group of Korean fishery workers. In this study, spino-pelvic parameters that showed differences among the ODI groups were SVA, PT, and PI-LL. Significant differences were observed in body composition parameters, including trunk fat/muscle ratio, psoas muscle mass, psoas muscle mass divided by weight, total muscle mass, skeletal muscle mass, and trunk muscle mass. We also found that ODI positively correlated with SVA and PT only in female.
According to previous studies, it is known that greater SVA, PI-LL, smaller LL, SS are associated with LBP [5,6]. The SVA is the most widely used measure of global sagittal balance and higher SVA value correlates with increased disability [6]. Regarding the relationship between LBP and PT, controversial results have been reported in previous studies [5,15]. Several studies were conducted on spinopelvic alignment of specific occupation like farmer [8,16]. Especially, a study recruiting Korean farmers revealed that LL was significantly smaller in subjects with LBP than in those without [17].
In our study subjected to Korean fishery workers, several parameters reflecting spino-pelvic alignment were observed to be related with ODI. Especially in female, there was a positive correlation between ODI score and SVA and PT, while no correlation was found in male. Based on an ODI score of 20, subjects were divided into low ODI group and high ODI group. The latter group showed greater SVA, PT, and PI-LL. It has been reported that SVA≥14.8 mm, PT≥17.9°, PI-LL≥2.7° are radiographic thresholds that predict moderate disability (ODI>20%) [15]. Consistent with previous research findings, larger SVA and PI were associated with more severe disability, and the previously controversial PT value also demonstrated such associations. Unlike the study of Korean farmers, there was no statistically significant LL difference between the low ODI group and the high ODI group in this study [17].
Recently, sarcopenia has attracted attention as one of the major causes of LBP. A number of papers have been published on the relationship between LBP and back muscle mass. Measuring CSA on MRI or computed tomography (CT) is widely used as accurate method of measuring the lumbar muscle mass. Studies found CSAs of back muscles such as multifidus, psoas and erector spinae were smaller in LBP patients [10,18]. A study also revealed that CSA of erector spinae was significantly smaller in chronic LBP group than that of the improved LBP group, suggesting the possibility of CSA of erector spinae as a prognostic factor [19]. However, it is still controversial which muscle is responsible among them.
DEXA, MRI, and CT require a lot of time, dedicated space for exam, are expensive, and there is also a limitation that DEXA and CT have the risk of radiation exposure. Therefore, interest in usefulness of BIA, which is easy, safe and cost-effective, is increasing. Several studies showed the amount of trunk muscle measured through BIA is proportional to the CSA of the actual back muscle and is also associated with the back muscle strength [20,21]. Additionally, a study demonstrated significant correlation between trunk muscle mass measured with BIA, ODI and EQ5D, and suggested the potential of BIA as an evaluation tool in patients with LBP [13].
In a paper on Korean farmers, ODI was found to have positive correlation with trunk fat/muscle ratio, total fat and visceral fat muscle mass in female farmers [22]. Back muscle mass and psoas muscle mass had no statistically significant correlation with the ODI score [22]. In this study of Korean fishery workers, no parameters measured by BIA or muscle mass calculated by CSA on spine MRI showed statistically significant correlation with ODI score in both male and female. Divided by ODI score, high ODI group had a larger trunk fat/muscle ratio and smaller total muscle mass, skeletal muscle mass, and trunk muscle mass. Similarly, it was found that psoas muscle CSA and psoas muscle CSA divided by weight are significantly smaller in high ODI group. As we did not reflect the muscle density, it can be thought that the psoas muscle, which is known to be less affected by fat infiltration than multifidus and erector spinae, showed significant difference [23].
The prevalence of LBP had been reported to be higher in female than in male, showing 1.28-fold higher among female in the 50-years or older age group [24]. In this study, VAS and ODI score of female were higher with statistical significance than those of male. Among spino-pelvic parameters, only PT angle presented statistically significant differernce between sexes, in contrast to a previous study on healthy population which reported that PI and PT were larger in female [25]. These sex differences can be affected by the subtypes of fishery work that they mainly engage in. 21.1% of female engaged in diving fishery while none of male did.
Workload and working posture also can contribute to the sex difference of LBP prevalence. A study found high workload is significantly associated with increased incidence of LBP in Danish fishermen [26]. A research showed that female were more likely to report back pain if they were “skilled agricultural, forestry, and fishery workers,” while LBP was found to be common in male engaging in “elementary occupation” [27] and contributed to our finding that specific pattern and posture of work, female generally assigned in, can provoke LBP. Regardless of the type of fishery, such as fishing fishery or aquaculture, male and female tend to have different division of roles. Females tend to work in squatting position doing manual jobs such as shucking oysters and trimming seafood or equipment. Working in sitting position with trunk flexion was suggested to be responsible for LBP in a research, which reported that the prevalence of lower back musculoskeletal disorders were 1.24 times higher in female shellfish gatherers [28]. Workload analysis for each fishery type is complicated because the environment and individual ways of work are not standardized and needed for further exploration of pathology of LBP.
For the sex differences in the correlation between LBP and spino-pelvic parameters, two other potential explanations are relevent based on our data. First, when comparing male and female in this study, female had higher ODI scores, which implies that a clear correlation with spino-pelvic alignment may only be observed when there’s a certain degree of disability. Second, based on the results of body composition analysis, female had smaller trunk muscle mass and greater trunk fat mass and fat/muscle ratio than those of male. The clinical importance of trunk muscle mass in association with disabilities arising from LBP was clarified in previous studies [29,30]. A study also found that the deterioration quality of life started with trunk muscle mass approximately <23 kg [31]. In this study, the average of trunk muscle mass was smaller in female as 19.70 kg, contributing to higher ODI score in female. Trunk muscle mass of male fishery workers was maintained larger (25.60 kg) and other parameters reflecting body composion such as total fat mass and skeletal muscle mass remained to be in better condition than those of female. For this reason, it can be assumed that the lack of trunk muscle mass in female did not exert an appropriate compensation mechanism for back pain caused by abnormal spinal alignment.
As this study aimed to explore the relationship between sagittal spine alignment, body composition, and LBP, we recognized the potential influence of structural anomalies of spine, such as HIVD, degenerative disc disease (DDD), FJD and spondylolisthesis. Consequently, we undertook a comprehensive review of the spinal disorders based on MRI findings (Supplementary Table S1). In this study, HIVD was observed in 19.18% and advanced disc degeneration was observed in 63.04% of the total participants. This rates appeared similar to the results of a previous study on asymptomatic individuals, where HIVD was identified in approximately 22% of individuals aged 40 to 59, and DDD was observed in 59% [32]. The prevalence of FJD also appeared to be consistent with prior research involving community-based populations [33]. Regarding the prevalence of spondylolisthesis, 80.14% were classified as normal and 19.86% exhibited grade 1 corresponding to less than 25% slippage. Similar finding had been identified with an earlier study targeting middle-aged individuals from the Beijing community which reported a prevalence of lumbar spondylolisthesis at 17.26% [34]. Based on these similar rates, it is assumed that these abnormal findings observed in the MRI of our study subjects can be considered not to exert a major impact on the outcomes of our research.
Several limitations should be considered in this study. First, it has targeted subjects who visited for medical check-up. Most of the subjects were able to walk independently and had almost no disability. Therefore, relatively good condition of participants made it hard to correlate variables with substantial degree of LBP that actually causes disability, as in patients visiting the spinal clinic. Second, this study was designed as a cross-sectional study. The results showed the relationships between LBP, spinal alignment and trunk muscle mass, but it could not be clearly determined which one is the cause or result of another. A longitudinal follow up and expanding to a cohort study is desirable. Third, we used gross CSA measurements within the borders of lumbar muscles not considering bias of muscle density. As we could not use Hounsfield units to reflect fat infiltration in muscle, we tried to increase the reliability of measurement by using the average value of the two examiners’ measurements. Finally, the differences in fishery working experience, daily working time, specific posture and working environment were not fully understood and reflected to our analysis.
In conclusion, this study suggests the relationship between LBP, sagittal spinal alignment and body composition in Korean male and female fishery workers. Multi-dimensional approach using spinal alignment and muscle mass can be considered for LBP evaluation especially when routine radiologic interpretation can not fully explain patient’s disability.