


INTRODUCTION
Stroke is one of the most common causes of high mortality and long-term disability worldwide [1]. The sequelae of a stroke are variable and depend on the types of brain lesions. In stroke patients, there are long-term muscle changes such as loss in muscle mass and increased intramuscular fat deposition affecting walking related balance. Stroke patients have reduced functional capacity and ability to perform activities of daily living including transfers and locomotion [2,3]. The loss of balance in stroke patients is caused by complex factors including sensory impairment, reduced body awareness, and cognitive impairment, but one of the most prominent causes is lower extremity weakness [2,4].
Furthermore, several studies showed significant correlations between knee extensor torque and functional movement [2,4,5]. Muscle activation capacity as well as muscle strength is strongly related to functional performance such as standing-up performance, transfer capacity, gait, and stair climbing speeds [2,4,5].
Isokinetic dynamometry measures the muscular forces that accompany constant angular velocity limb movements in variable joints and it is a reliable test for evaluating muscle strength in patients with stroke [6]. Kristensen et al. [7] suggested that both paretic and non-paretic lower extremity strengths evaluated by the isokinetic device were correlated with walking related balance. Peak torque (PT) is considered to have good test-retest reliability as PT measures the maximal muscle force when the angle for knee flexion is in the range of 70° to 80° [8]. In other words maximum voluntary torque is known to be angle-dependent [9].
The rate of force development (RFD) is another parameter that examines how quickly force can be exerted [10]. The RFD measured by a handheld dynamometer during isometric contraction of the paretic knee extensor is established to predict the gait speed in stroke patients [10]. One study presented that the RFD during the first 150 ms of isometric knee extension helps predict gait speed better than PT after stroke [11]. Osawa et al. [12] reported that RFD was a significant predictor of gait speed during a 6m walk at usual and fast pace and time to complete 5 and 10 chair sit to stand tests in elderly men. Schlenstedt et al. [13] have confirmed the relationship between the enhancement of RFD and the improvement of postural control. Granacher et al. [14] reported that balance training resulted in significantly improved postural control, increased jumping height and enhanced RFD of the leg extensors. While explosive strength is the ability to make a torque as quickly as possible [15], explosive voluntary torque has been reported to be angle-independent during the early phase (≤75 ms) of contraction [16]. Maffiuletti et al. [17] reported that the RFD is determined by the capacity to produce maximal voluntary activation in the first 50 to 75 ms of explosive muscle contractions, which is the ability to increase motor unit recruitment and discharge rate. Moreover, Lodha et al. [18] demonstrated that motor control such as agility and accuracy is more meaningful than strength in predicting functional mobility in high-functioning stroke individuals.
But, Maffiuletti’s research group asserted that the RFD measurement is quite difficult to come to valid and reliable evaluation [17]. Therefore, the purpose of this study is to identify which parameters among the routine isokinetic test indices are related to the explosive strength of the knee joint without utilizing additional devices such as electromyography and time recording dynamometer. To our knowledge, there are few studies related to TOA, and we assumed that TOA, the first detected point of torque, of the knee extensor reflects explosive strength in the knee extensor and it can be analogous to the RFD or explosive strength in the early contraction phase. In addition, because the type II muscle fiber ratio increases after stroke, we hypothesized that TOA, as an indicator related to initial explosive strength, would be related to walking-related balance parameters. Therefore, in this study, we studied the relationship between TOA and gait speed as well as other walking related balance parameters in stroke patients.
METHODS
Participants
We retrospectively reviewed stroke patients admitted to the rehabilitation unit in our institution from June 2010 to February 2020. The inclusion criteria were as follows: patients who (1) experienced a first-ever stroke; (2) were hemiplegic and had been diagnosed with hemorrhagic or ischemic supratentorial stroke using computed tomography or magnetic resonance imaging; (3) had post-onset duration less than 6 months; (4) had an isokinetic test of the knee at least twice and had walking related balance tests within a week of the second isokinetic test; (5) had sufficient mental capacity to be able to participate in the isokinetic test properly (Korean version of the Mini-Mental State Examination, K-MMSE≥24); and (6) were aged between 18 and 65 years. The following exclusion criteria were applied: (1) quadriplegic, double hemiplegic, and paraplegic patients; (2) patients who have ataxia; (3) patients who have any other brain lesion; (4) patients who have a musculoskeletal disease or severe osteoporosis that could affect walking related balance; (5) patients who have an uncontrolled medical problem; (6) patients whose motor grade of the lower extremity of hemiplegic side by manual muscle test were less than 3/5; (7) patients with limited knee joint movement; and (8) spasticity of L/Ex with Modified Ashworth Scale (MAS) grade higher than 2.
One hundred two patients satisfied the inclusion criteria. The baseline characteristics (sex, paretic side, subtype of stroke, age, height, weight, body mass index [BMI], K-MMSE, onset duration (i.e., time since the onset of stroke), spasticity (by MAS), isokinetic test results and walking related balance parameters (Berg Balance Scale sub-score [sBBS], Timed Up and Go test [TUG], 10-m Walk Test [10MWT] and Functional Independence Measure sub-score [sFIM]) of these patients were collected retrospectively. All inpatients received physical therapy twice a day for 30 minutes, 5 days a week for a hospitalization period of 2 months on average, and isokinetic knee exercise of 3 times a week. The study protocol was approved by the Institutional Review Board (IRB) of Bundang Jesaeng Hospital (IRB No. 2022-05-008), and informed consent was waived owing to the retrospective design of the study.
Isokinetic parameters assessment
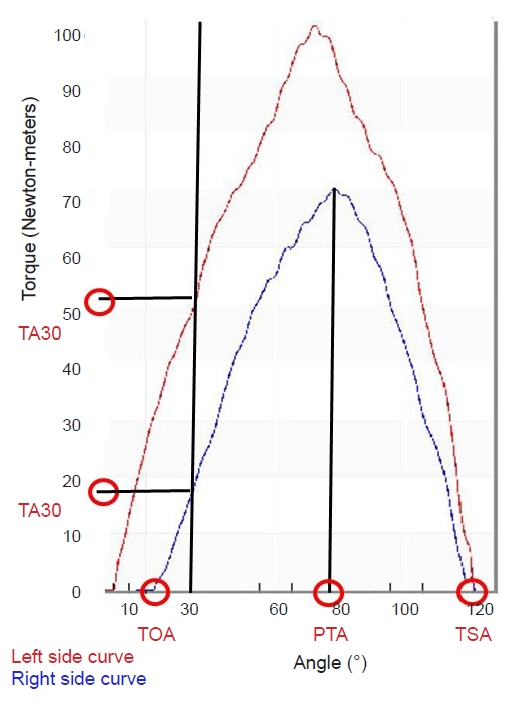
Patients performed three trials of isokinetic knee extension at an angle speed of 60/60 deg/sec using HUMAC NORM® isokinetic dynamometer and had a 10 seconds break between each trial. Several studies used the variable range of angular velocity to test the knee extensor at 12 to 500 degrees/second. Specifically, any speed between 60 and 180 degrees/second would generally meet most requirements for validity and the need for information about muscle performance [19]. Thus, we used 60 degrees/second angular velocity. In the test, patients were asked to extend their paretic side knee as much as possible with a tester’s verbal encouragement. In addition, we delayed the test in case of complaints of fatigue or getting an inappropriate moment angle position (MAP) curve pattern. We used values from a follow-up test a month after the first test (i.e., the second isokinetic assessment after familiarizing patients with isokinetic exercise). Torque onset angle (TOA) is the angle at which the initial torque was detected in the MAP curve (Fig. 1). We also included other isokinetic parameters, such as peak torque angle (PTA), difference between TSA TOA values (TSA-TOA), PT, peak torque to weight ratio (PTWR), total work (TW), hamstring peak torque (HPT), hamstring/quadriceps ratio (H/Q ratio), torque stop angle (TSA), torque at 30 degrees (TA30) and asymmetry ratio of peak torque between paretic limb and non-paretic limb comprising non-paretic peak torque minus paretic peak torque (PT deficit), Non-paretic peak torque/Paretic peak torque×100 (PT ratio) and Non-paretic torque at 30/Paretic torque at 30×100 (TA30 ratio) to determine which of the isokinetic parameters correlated most with the walking related balance parameters. TSA is the angle at which the last torque is detected in the MAP curve (Fig. 1).
Walking related balance parameters assessment
The parameters of walking related balance were measured with BBS sub-score (sBBS, turning 360° and placing alternate foot on stool), TUG, 10MWT, FIM sub-score (sFIM, transfers and locomotion) within a week of the isokinetic test for equivalent functional status. Patients were also tested on auditory feedback for maximal contraction. BBS is a 14-item assessment to evaluate the balance. Each item is rated on a five-point scale from 0 to 4, with a maximum score of 56. We checked sBBS consisting of turning 360° and placing alternate foot on stool while standing unsupported, which are related to the ability to initiate movement [20]. TUG is a test that evaluates functional mobility including static and dynamic balance. The test checks the time (in seconds) taken for patients to get up from a chair, walk 3 m as fast as possible, turn around, return back to the chair, and sit down [21]. 10MWT originally assesses gait speed in meters per second over 10 m, but instead, we measured the time taken to walk 10 m. Participants were asked to walk 10 m as fast as possible and we measured the time using a stopwatch [22]. FIM is an 18-item measurement that evaluates self-care, sphincter control, transfers (mobility), locomotion, communication, and social cognition with a maximum score of 126. Among these items, we focused on transfers and locomotion items that are related to functional mobility in sFIM [23].
Statistical analysis
Pearson’s correlation coefficient and partial correlation coefficient were used to measure the strength and direction of a linear relationship between isokinetic parameters and walking related balance parameters. We used multiple regression analysis with stepwise (backward elimination, p>0.10 for exclusion) to identify statistically significant isokinetic parameters associated with walking related balance parameters. In this study, we used IBM SPSS Statistics version 21.0 (IBM SPSS) for all statistical analysis. A p-value of less than 0.05 was defined as statistically significant.
RESULTS
Patient general characteristics
One hundred-two patients were enrolled. The baseline characteristics of the study population are presented in Table 1. The study population comprised 69 (67.6%) male and 33 (32.4%) female, 52 (51%) right hemiplegia and 50 (49%) left hemiplegia, 53 (52%) ischemic, and 49 (48%) hemorrhagic stroke patients. The patients’ mean age was 49.8±11.5 years. The mean height and weight were 166.5±7.2 cm and 66.8±13.8 kg, respectively. The mean BMI was 24.0±4.2 kg/m2. The patients’ mean K-MMSE score at the time of the test was 26.7±2.3. The mean time since the onset of the stroke was 52.0±34.4 days. MAS score distribution ranged from 0 to 2, with an average of 0.15±0.38.
Outcome measures
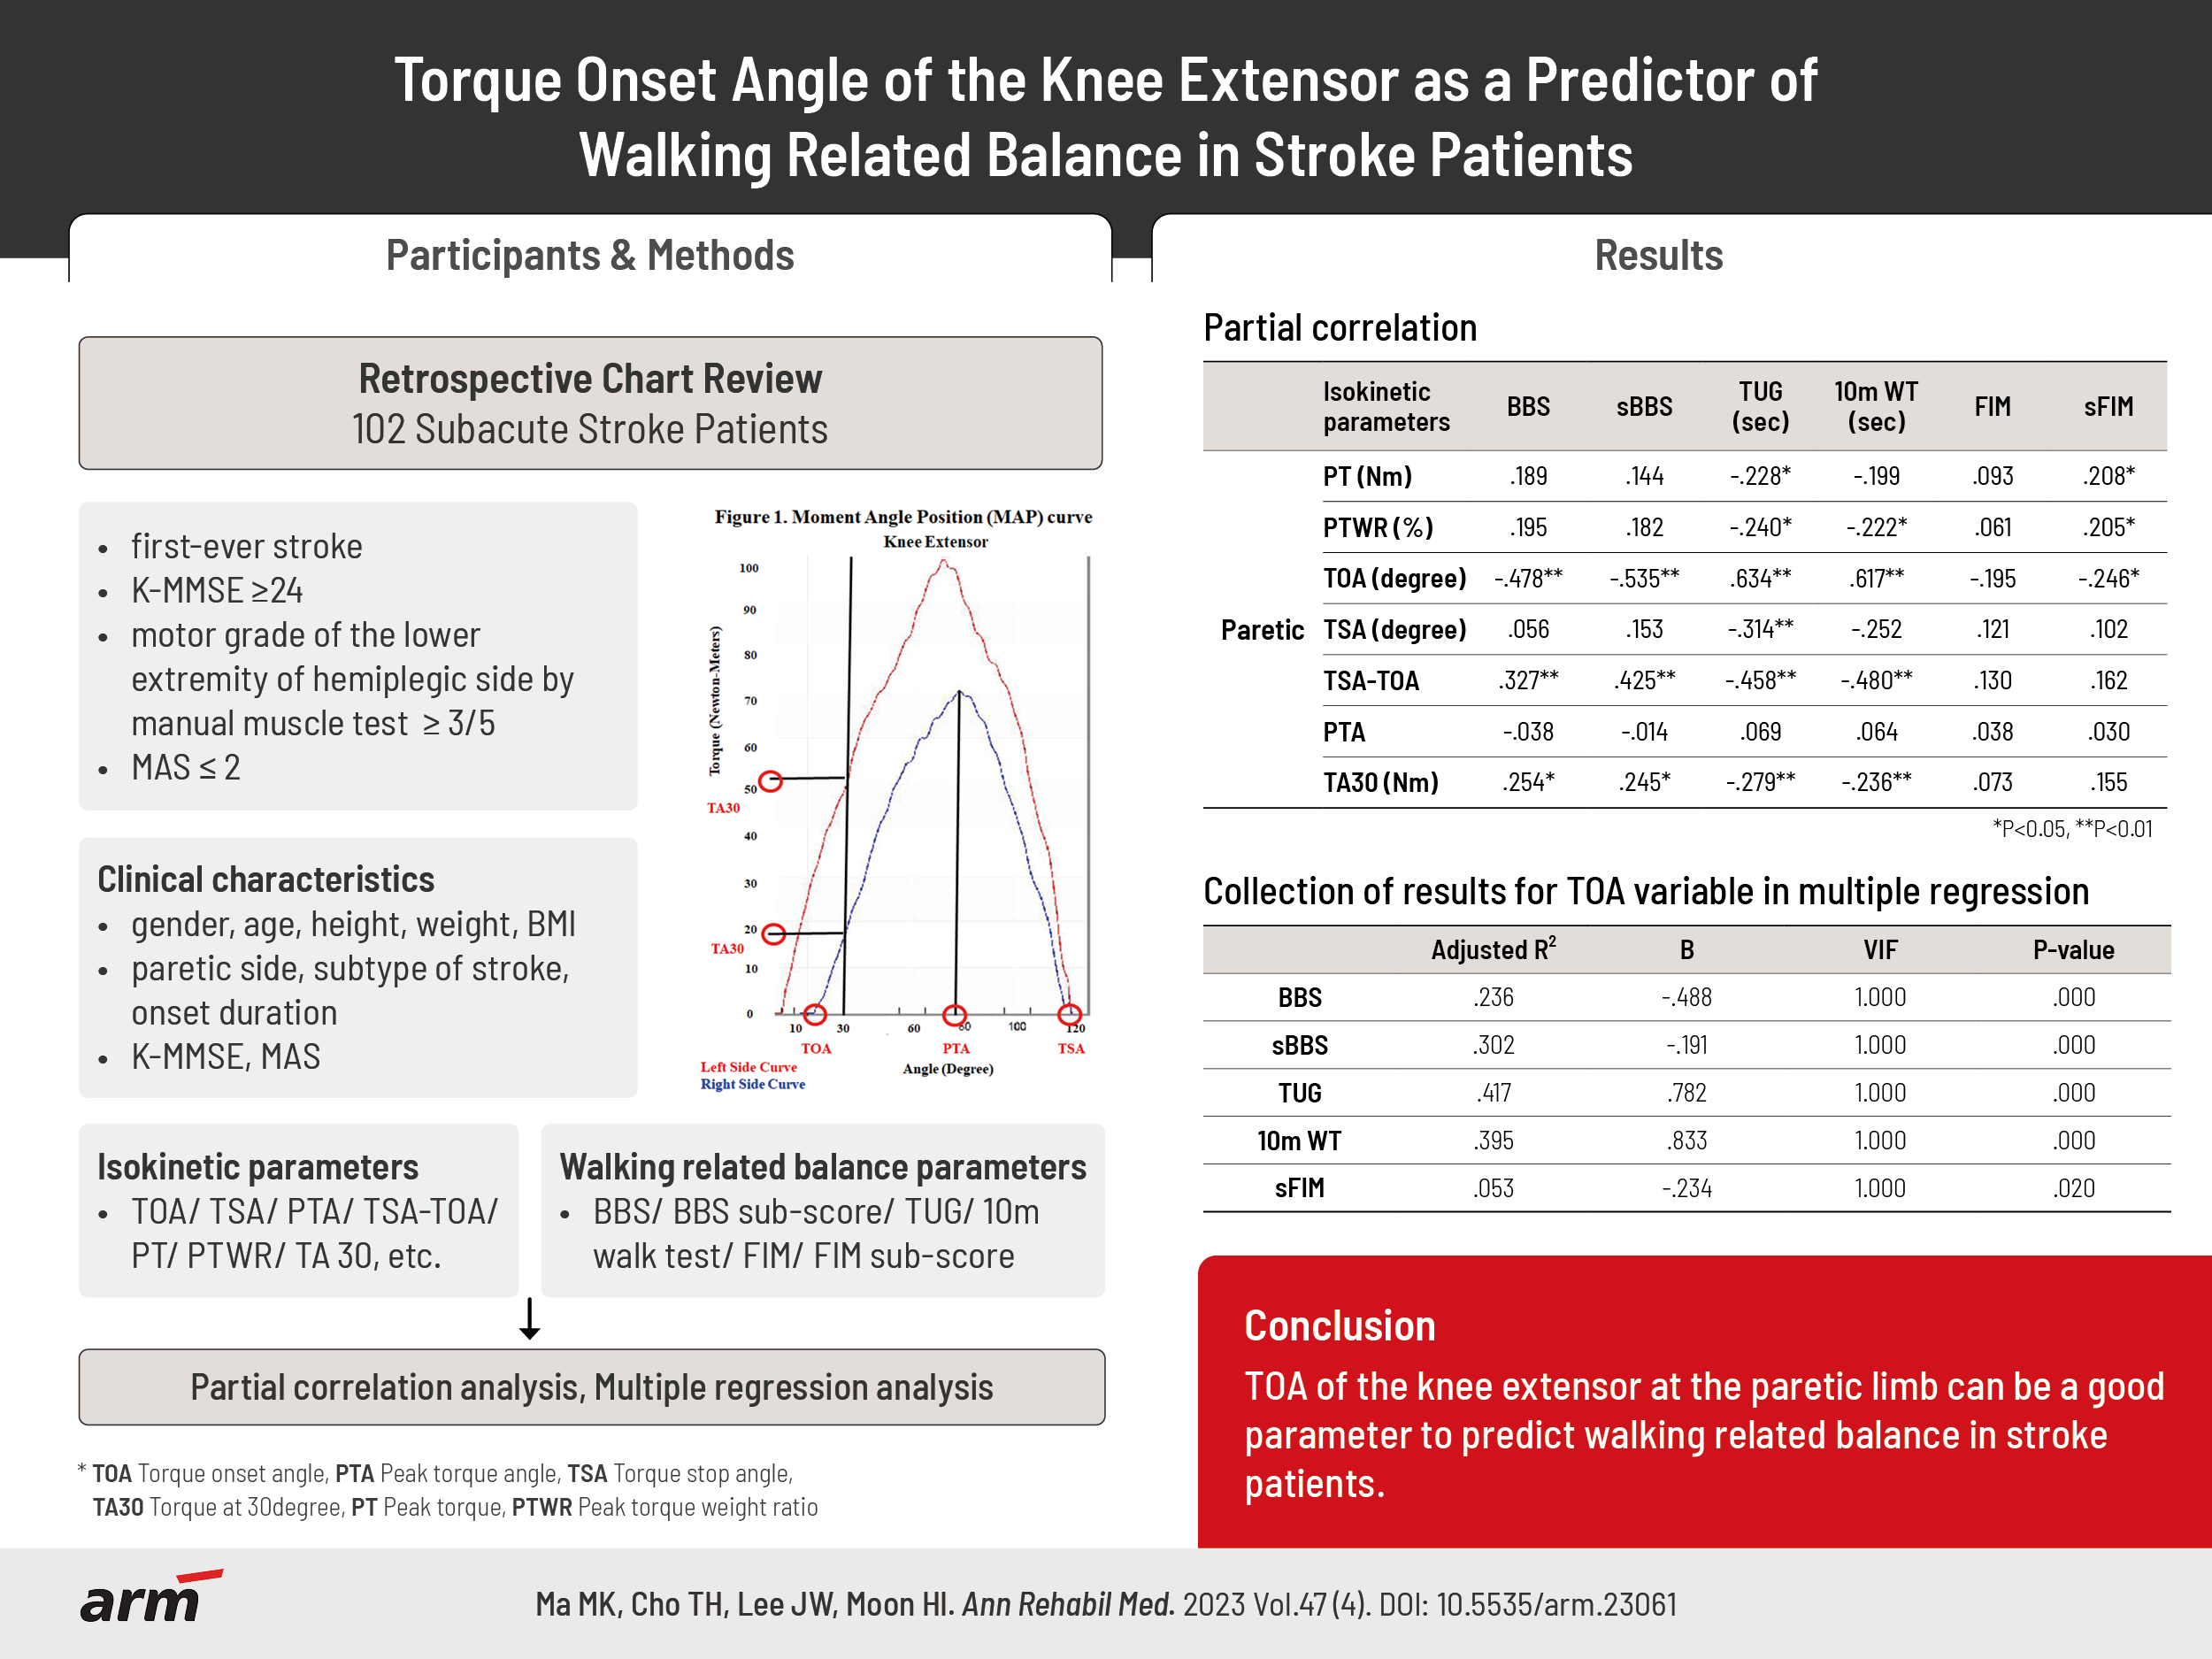
Table 2 is the results of Pearson’s correlation coefficients between walking related balance parameters and isokinetic parameters including the paretic and non-paretic sides of the knee, and asymmetry ratio values. TOA, PT, PTWR, TW, HPT, TSA-TOA and TA30 of the paretic limb were significantly associated with walking related balance parameters. TOA of the paretic limb showed moderate to good correlations with sBBS (r=-0.556), TUG (r=0.646), 10MWT (r=0.629), sFIM (r=-0.229).
The results of the partial correlation between isokinetic parameters of the paretic side of the knee and walking related balance parameters adjusted by sex, age, height, weight, BMI, MMSE, onset duration, and spasticity are presented in Table 3. As a result, TOA, TSA-TOA, TA30, PT ratio, and TA30 ratio were significantly associated with walking related balance parameters. According to guidelines provided by Portney and Watkins, only TOA of the paretic limb showed moderate to good correlations (r-value between 0.50 and 0.75) walking related balance parameters, while TSA-TOA, TA30, PT ratio and TA30 ratio showed a fair correlation (r-value between 0.25 and 0.50) with walking related balance parameters [24]. Therefore, TOA showed the highest correlation with walking related balance parameters among isokinetic parameters.
In multivariate multiple regression using TOA, PT, TSA-TOA and TA30 as independent variables and walking related balance parameters as dependent variables, TOA was significantly associated with walking related balance parameters (BBS, sBBS, TUG, 10MWT, sFIM) except for FIM scores (Table 4). As the obtained variance inflation factor (VIF) values were all <2, it was concluded that there was no significant multicollinearity among the independent regressors. These results show that the TOA, as an explanatory variable, is independently associated with walking related balance parameters.
DISCUSSION
In this study, we aimed to find a new parameter to predict walking related balance. Many stroke centers conduct isokinetic training for strengthening and assessing the strength of the movement using special devices. Hence, we took the TOA among isokinetic test results into consideration. We assumed that it is analogous to the RFD or explosive strength in the early contraction phase. Additionally, it is relatively easy to obtain from the isokinetic test.
TOA
TOA of the paretic side has a moderate to good correlation coefficient with the walking related balance as shown in Table 2. As far as we are concerned, the concept of TOA has not received attention. Other studies use the time point above 2% of maximal voluntary isometric contraction as a torque onset [12,25]. Special devices are required to evaluate and measure the RFD during isometric contraction. However, TOA is easily obtained from the routine isokinetic test.
In terms of neuromuscular recruitment patterns, both slow, fatigue-resistant type I and fast, more fatigable type II muscle fibers are activated together at lower speeds. Whereas when the speed increases, type I fibers gradually get recruited less and eventually become inactive. Reaching 40% of the peak torque, type II muscle fibers work the most, then the work done by type II muscle fibers gradually decreases, and type I fibers do all the work [8]. TOA is likely to reflect a type II fibromuscular condition, as it is detected during initial acceleration phase of the isokinetic test.
Hemiplegic patients have a lot of muscle abnormalities with a combination of denervation, disuse, remodeling, and spasticity. A decrease in muscle strength is a consequence of impaired motor unit recruitment and muscle changes such as atrophy [26,27]. Muscle tissue changes in normal aging are characterized by changes in the distribution of fiber types, with a decrease in type II fibers and an increase in mitochondria-rich type I fibers, resulting in the reduction of muscle strength. In contrast to this age-dependent muscle fiber type shift, a slow to fast fiber type conversion has been reported in the paretic limb muscle in stroke patients [28,29]. Muscle fibers can change their phenotype in response to environmental stimuli, including disuse, neural innervation patterns, and exercise. Under conditions of reduced muscle use and fast-frequency electrical stimulation, a slow, fatigue-resistant type I muscle fiber can alter its phenotype to a fast, more fatigable type II. In stroke patients, the total muscle fiber cross-sectional diameter decreases, and the ratio of type II muscle fibers increases due to various reasons. Thus, type II muscle fiber-related parameters may be a good indicator of muscle function in stroke patients. Therefore, we suggest the significance of TOA in predicting explosive strength in stroke patients [30].
In stroke patients, disturbed neural control, as a result of, for instance, impaired reciprocal inhibition, make an abnormal coactivation of antagonistic muscles during maximal voluntary contraction [4,31]. Abnormal muscle synergy is the cause of impairment of balance and gait speed [32]. This abnormal muscle synergy is also observed in spasticity, that is, spasticity can also be a factor in determining the TOA value. Therefore, we excluded patients with MAS grade 2 or higher. Rabita et al. [33] reported acceleration amount of the isokinetic device is not sufficient to generate a stretch reflex on spastic muscle, unlike the transient acceleration of the manual displacement. Additionally, knee flexor spasticity in our study patients was in the range of MAS grade from 0 to 1+ (Table 1; mean, 0.15±0.38; mostly 0 and 1). Furthermore, TOA is measured in the initial phase of motion, so MAS grade 1 or 2 spasticity is not likely to affect the TOA.
In stroke patients, strength and function are influenced by the onset duration, weight, center of gravity (height), spasticity, cognition, etc. [34-37]. So we performed a partial correlation analysis adjusted by variable factors. Table 3 shows that TOA showed a constant correlation with walking related balance parameters.
PT, PTWR, HPT, TW and H/Q ratio and asymmetry of PT ratio
PT, PTWR, HPT and TW which represent strength on the paretic side have also a correlation with walking related balance parameters (e.g., sBBS, TUG, 10WT, sFIM) [38].
Both paretic and non-paretic knee extensor muscle strengths correlated with locomotion [4,38]. But our study revealed that parameters of the isokinetic test on the non-paretic limb did not have a consistent relationship with the walking related balance parameters. We enrolled relatively high-function patients who are able to walk without ambulation aid and do the isokinetic test properly. If we enrolled patients with severe weakness, the isokinetic parameters of the non-paretic side might have been related to the walking related balance parameters because compensatory use of the intact limb is an important strategy to overcome functional impairment of weakness.
In this study, the PT ratio of hamstring to quadriceps (H/Q ratio) representing muscle balance was not related to walking related balance. Generally, the quadriceps will be twice the strength of the hamstring, and athletes have a higher H/Q ratio [39,40]. Our patients have a similar H/Q ratio to the general population, meaning there was no significant imbalance.
Limitations
First, our study included relatively high-functioning stroke patients who could take isokinetic test properly, and thus, we identified the validity of TOA in a narrow sample. Second, this is a retrospective study, we could not control the patients’ conditions such as spasticity, warm-up status, capacity, and so on. Third, TOA is not a value that is recorded automatically from devices. We get the value of TOA using a mathematical formula by measuring the length from the result sheet. Therefore, there may be measurement errors, and since one tester performed it, not seeing inter-tester reliability can be a limitation.
Most of all, more studies of TOA are needed to be done. TOA is an indicator that can be measured relatively easily in the isokinetic test, but it has not received much attention and there are few studies related to reliability. Therefore, it seems that more research on this seems to be needed in the future.
In conclusion, we have not been focusing on the TOA value in the isokinetic test parameters, but TOA of the knee extensor at the paretic limb can be a good parameter to predict walking related balance in stroke patients. Finally, our study suggests that the ability to recruit muscle fiber quickly is also important in walking related balance.