


INTRODUCTION
Hand grip strength (HGS) has been recognized as a reliable proxy indicator of an individual’s overall physical function. It is a powerful predictor of morbidity, disability, and mortality and is a major diagnostic component of frailty and sarcopenia in adulthood [1]. A weak HGS is an early marker of age-related functional decline because grip strength is associated with physical function and independence among community-dwelling older adults [2].
A comprehensive analysis of a specific population may be necessary for a reliable interpretation of HGS. A previous study compared the impact of different occupations on musculoskeletal fitness. The study was conducted in 45 normal adult males, which included video display operators, industrial workers and safety inspectors. The observed values of grip strength were significantly lower in video display terminal operators while significantly higher in safety inspectors and moderate in industrial workers. The findings clearly indicate that grip strength varies significantly in different occupations. Heavy muscular load might lead to an accumulation of metabolic waste and toxins in the muscle resulting in lower grip strength [3]. Based on these findings, farmers may also be at high risk of having low grip strength, because farming entails strenuous physical activities and high levels of manual labor.
Therefore, HGS is increasingly being measured under clinical settings. Maximal isometric HGS measurements have been widely used because of their simplicity, convenience, and high reliability [4].Various factors may influence HGS and confound the interpretation of clinical measurements. These factors include demographics (age and sex), anthropometrics (height, weight, bone mineral density, hand size, upper arm circumference, and hand dominance), socio-economic status (occupation, social status, and lifestyle), physical and psychosocial variables, and ethnicity [5,6].
Grip strength has been correlated with factors such as age, employment status, and altered cognitive function among rural community dwellers in Brazil [7]. In Korea, HGS is independently associated with age and height in both sexes and related to body mass index (BMI) in men [8]. Current smoking, low educational level, and low income have also been implicated as independent risk factors for decreased HGS among elderly Korean men [9]. However, this study was limited to the elderly population, and the investigated factors were limited, without adjustment for sex, age, and height.
Gangwon Province is a representative agricultural region in Korea with relatively low medical accessibility. Studies investigating the grip strength and the associated factors in Korean farmers are unavailable. We hypothesized that specific factors were associated with grip strength in farming workers in Korea.
The purpose of this study was to identify the potential factors associated with HGS in healthy Korean farmers after adjusting for confounding factors using survey data from the Farmers’ Cohort for Agricultural Work-Related Musculoskeletal disorders (FARM) study.
MATERIALS AND METHODS
Study participants
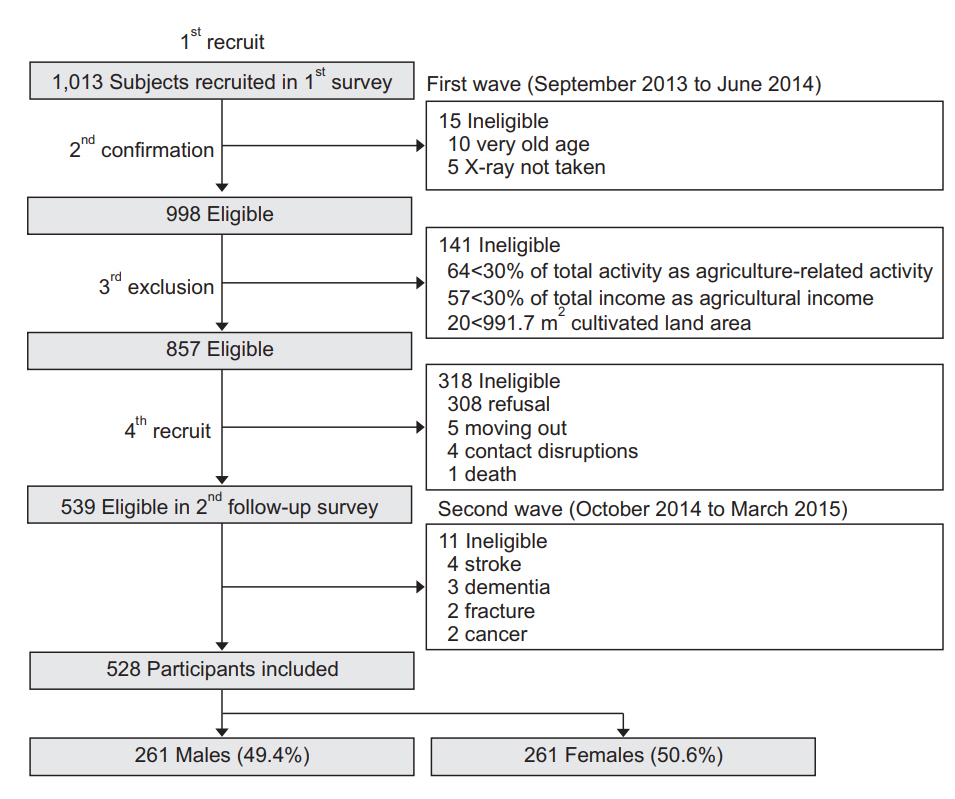
This study was conducted as a cross-sectional analysis of the second wave of the FARM study (from October 2014 through March 2015), designed to assess the musculoskeletal disorders of farmers in Gangwon Province of South Korea. It was conducted by the Center for Farmers’ Safety and Health at the Kangwon National University Hospital and supported by the Korean Ministry of Agriculture, Food and Rural Affairs since 2013 [10]. Fig. 1 shows the flowchart outlining the participant selection. Initially, 1,013 farmers participating in the first wave of the FARM study (September 2013 to June 2014) were classified as active (n=857) or inactive (n=141) farmers based on their agricultural activity (≥30% of total activity), agricultural income (≥30% of total income), and cultivated land area (≥991.7 m2) after exclusion of very elderly (n=10) and non-radiographed (n=5) farmers. A total of 539 farmers were enrolled secondarily, after excluding 318 farmers based on their refusal to participate (n=308), change of residence (n=5), contact disruptions (n=4), and death (n=1).
In this study, subjects with a pre-existing neurological or psychiatric disease or disease that may affect hand grip strength or the ability to answer a questionnaire were excluded. Based on these criteria subjects were excluded for the following conditions: stroke (n=4), dementia (n=3), cancer (n=2), and history of fracture in the upper extremity (n=2). After these exclusions, 528 participants were included in the analysis. There were 261 male farmers (49.4%) and 267 female farmers (50.6%).
This study was approved by the Institutional Review Board of the Kangwon National University Hospital (No. 2013-06-009-007) and written informed consent was obtained from all of the subjects. This study was also registered with the Clinical Research Information Service (No. KCT0000829, http://cris.nih.go.kr).
Hand grip strength measurement
HGS was assessed by trained technicians using a Jamar 5030J1 hydraulic hand dynamometer (Sammons Preston, Bolingbrook, IL, USA). Following the American Society of Hand Therapists’ recommendation for testing grip strength, the measurements were recorded in kilograms [11]. Subjects were seated comfortably on a chair without armrests. The shoulder was adducted and neutrally rotated. The elbow was held at 90° of flexion and the forearm and wrist were maintained in a neutral position. Standard verbal encouragement (‘squeeze the handle as hard as possible’) was used in the same tone of voice during the measurements. Maximal isometric grip strength was recorded with a 15-second interval for both hands. Three measurements of each grip and pinch were obtained and the mean values were analyzed.
Socio-demographic factors
Demographic factors, such as age (year), gender (male/female), marital age (year), amount of smoking (packyear), and alcohol drinking (g/day) were assessed. Agricultural characteristics, including total annual duration (hour) spent on agriculture, total annual household and parenting hours, total annual extra-working hours, total annual working hours, and total cropland area (m2), were determined using a structured questionnaire.
Anthropometric measurements
Height (cm) and body weight (kg) were measured automatically during the body composition measurement. BMI (kg/m2) was calculated as weight in kilograms divided by the square of height in meters. Body composition was measured using single-frequency bioelectrical impedance analysis (IOI 353; Jawon Medical, Seoul, Korea) to determine the percent body fat (%), total body water (L), body fat mass (kg), fat-free mass (kg), soft lean mass (kg), mineral mass (kg), and protein mass (kg).
Psycho-cognitive factors
The Korean version of the Center for Epidemiological Studies Depression Scale (CES-D) was used to assess the presence and severity of depressive symptoms during the past week [12]. CES-D is a 20-item self-reported instrument with a 4-point scale and a total score range from 0 to 60. On this scale, higher scores indicate more severe depressive symptoms.
To evaluate sleep quality, the Korean version of the Pittsburgh Sleep Quality Index (PSQI) was used. The PSQI comprises 18 questions and assesses sleep quality, sleep onset latency, sleep length, sleep efficiency, sleep deprivation, use of sleeping pills, and daytime dysfunction [13]. On the PSQI, each question is assigned a score ranging from 0 to 3 points and the total score ranges from 0 to 21. Subjects scoring greater than 5 indicate poor sleep quality.
To evaluate cognition, the Korean version of the Mini-Mental State Examination (MMSE-KC) based on the Consortium to Establish a Registry for Alzheimer’s Disease (CERAD) assessment packet was used. The MMSE-KC contains 19 items, with a maximum score of 30 points (10 points for orientation, 6 for verbal memory, 5 for concentration and calculation, 5 for language, 3 for praxis, 1 for visuospatial construction) [14].
The degree of attention was measured using a response time (ms) based on a computerized Go/No-Go test (SuperLab Pro v.4.0 software; Cedrus Corporation, San Pedro, CA, USA). A total of 30 green or black circles were randomly displayed at the center of a computer screen for 3,000 ms at randomized intervals of 1, 2, or 3 seconds between each circle. The patient was asked to press a key as quickly as possible when a green circle appeared and to avoid pressing the key when a black circle was presented.
Physical factors
The Korean version of the International Physical Activity Questionnaire (IPAQ) was used to evaluate the participant’s physical activity level [15]. The 7 items of the IPAQ identify the total time (min) spent on physical activity of moderate to vigorous intensity over the last 7 days, walking, and inactivity. Replies were converted to metabolic equivalent task minutes per week (MET-min/wk) according to the IPAQ scoring method. An average MET score was derived for each type of activity. The following MET values were used: walking=3.3 METs, moderate physical activity=4.0 METs, and vigorous physical activity=8.0 METs. The total physical activity was calculated as the sum of the MET-min/wk values derived from walking, moderate activity, and vigorous activity.
Serologic factors
Blood samples (5 mL) were collected. After centrifugation, they were stored in a portable refrigerator and hematologic and biochemical factors related to hand grip strength were analyzed at Kangwon National University Hospital. The assessed variables were white blood cell count (103/μL), hemoglobin (g/dL), C-reactive protein (mg/dL), albumin (g/dL), total protein (g/dL), interleukin-6 (pg/mL), hemoglobin A1c (%), vitamin D (ng/mL), and insulin-like growth factor 1 (IGF-1) (ng/mL).
Statistical analysis
Descriptive statistics were used to determine the participants’ characteristics. Comparison between male and female farmers was carried out using the Student t-test. Pearson partial correlation coefficient was used to analyze the relationship between various factors and HGS after adjustment for age, height, and weight. The variables that reached a significance level of p<0.05 were included in the multivariate analyses. A stepwise multiple linear regression analysis was used to assess the relative contributions of each factor that influenced HGS.
Because sex acts as a confounding variable, the analysis was divided into two groups: male and female. All of the statistical analyses were performed using the SPSS statistical package, version 22.0 (IBM SPSS, Armonk, NY, USA) for Windows.
RESULTS
A total of 528 Korean farmers (mean age, 58.7 years) were enrolled. Age ranged between 40 and 73 years. Table 1 shows the participant demographics including male versus female farmers. The socio-demographic characteristics showed significant gender differences. The mean HGS of male farmers was higher than that of female farmers (33.3±6.8 vs. 18.1±4.2 kg, p<0.001). Male farmers smoked more (21.8±22.9 vs. 0.14±1.6 pack-year, p<0.001) and consumed more alcohol (16.3±31.8 vs. 8.7±18.8 g/day, p<0.001) compared with the female farmers. Female farmers reported higher total annual household and parenting hours (101.8±227.0 vs. 920.2±438.6, p<0.001) and total working hours (2,852.4±767.0 vs. 3,347.2±892.2, p<0.001), even though male farmers spent higher number of total hours on agriculture annually (2,534.2±836.0 vs. 2,293.2±837.1, p<0.001). Anthropometric measurements including total body water (38.9±5.0 vs. 29.1±3.3 L, p<0.001), fat-free mass (54.1±6.9 vs. 40.5±4.6 kg, p<0.001), soft lean mass (50.0±6.4 vs. 37.0±4.1 kg, p<0.001), mineral mass (4.1±0.6 vs. 3.4±0.5 kg, p<0.001), and protein mass (11.1±1.4 vs. 7.9±0.8 kg, p<0.001) were higher in male farmers. Percent body fat (23.1%±4.4% vs. 33.1%±4.2%, p<0.001) and body fat mass (16.5±4.8 vs. 20.4±5.3 kg, p<0.001) were higher in the female farmers.
Table 1 shows the baseline measurements of significant related factors in recruited subjects, male vs. female farmers. The total scores of the CES-D (8.2±5.7 vs. 11.1±7.9, p<0.001) and PSQI (10.2±4.8 vs. 12.7±6.0, p<0.001) were significantly higher in the female farmers, indicating a more depressive mood and poorer sleep quality. The total MMSE-KC score was higher (25.6±3.0 vs. 25.0±3.0, p=0.013), and the correct response time of Go/No-Go test was more rapid (617.4±181.7 vs. 676.4±227.8 ms, p 0.001) in the male farmers, indicating better cognition compared with female farmers. In terms of serologic measurements, hemoglobin (15.0±1.3 vs. 13.4±1.1 g/dL, p<0.001) and vitamin D levels (20.6±7.1 vs. 15.6±6.3 ng/mL, p<0.001) were higher in the male farmers, while the total protein level (7.1±0.4 vs. 7.2±0.4 g/dL, p<0.001) was higher in the female farmers.
Table 2 shows the Pearson partial correlation coefficients between HGS and demographic characteristics after adjusting for age, height, and weight, which showed no statistically significant association in male farmers, compared with significant correlation with smoking pack-years in female farmers (r=-0.14, p=0.03).
HGS in male farmers was significantly correlated with the total score of PSQI (r=-0.15, p=0.02) and MMSE-KC (r=0.19, p=0.003), correct response time of Go/No-Go test (r=-0.23, p<0.001), and serologic level of vitamin D (r=0.16, p=0.01), IGF-1 (r=0.16, p=0.01), and hemoglobin A1c (r=-0.13, p<0.05). In female farmers, the total scores of CES-D (r=-0.19, p=0.002), PSQI (r=-0.37, p<0.001), and MMSE-KC (r=0.13, p=0.04), serologic level of total protein (r=0.12, p=0.047) and IGF-1 (r=-0.18, p=0.003) were significantly correlated with HGS (Table 2).
Table 3 shows the results of stepwise multiple linear regression analysis. The male farmers’ HGS was independently associated with the total score of PSQI (β=-0.12, p=0.01), correct response time of Go/No-Go test (β=-0.18, p=0.001), and serologic levels of vitamin D (β=0.12, p=0.02) and IGF-1 (β=0.1, p=0.046). By contrast, in female farmers HGS was significantly associated only with the total PSQI score (β=-0.32, p<0.001).
DISCUSSION
This study found that HGS could be influenced by sleep quality in both male and female farmers. In male farmers, HGS might also be influenced by cognition and IGF-1.
Physical function plays a critical etiological role in major geriatric syndromes, such as frailty, falls, sarcopenia, and impaired mobility [16]. Moreover, the loss of physical function is associated with poor recovery from illness. Thus, the ability to screen patients based on physical function is an important public health issue.
Compared with the strength of the lower extremities, HGS is affected less by loss in muscle mass due to aging or sedentary behavior [17]. HGS is critical to meet the demands of daily living. Therefore, this study adopted HGS to easily and consistently represent functional ability. HGS has been used as a measure of various health-related conditions [6]. Although HGS has been known to be affected by physical, psychological, and other factors [18], no study has analyzed those factors comprehensively in a population-based cohort. This study identified the relationship between HGS and associated factors in healthy Korean farmers.
Generally, HGS tends to peak at 25–40 years of age and decreases in both men and women [19,20]. HGS decreases faster in men than it does in women and the gap between genders is bridged with age. Previous studies have reported a clear gender difference with higher HGS in males. In this study, we analyzed the recruited cohort according to gender for the association between HGS and related factors.
This study found that subjective sleep quality may be associated with HGS in male and female farmers. The association between sleep quality and physical performance has been reported in patients diagnosed with chronic obstructive pulmonary disease [21], athletes [22] and the elderly [23]. Additionally, poor sleep quality is associated with sarcopenia [24]. Poor sleep quality may directly result in decreased muscle strength because of the prolonged periods in bed. In these circumstances, decreased neuromuscular function mediates the relationship between poor sleep quality and adverse health outcomes. The poor sleepers were found to manifest weaker HGS irrespective of muscle mass [25] indicating that additional intrinsic factors may be responsible for the association between poor sleep quality and weak HGS [26]. Such factors should be investigated in future studies.
This study also found that HGS may be associated with attention, due to three potential factors. First, the changes in cognition alter the grip strength. Second, the changes in grip strength drive changes in cognition. Third, cognition and grip are similarly affected by another variable. Previous longitudinal studies in the elderly reported that poor HGS predicted cognitive decline [27], which precedes functional decline [28]. Even though a causal relationship between HGS and cognition could not be established, these associations may support a strategy of improving cognition in order to enhance functional ability or vice versa.
Moreover, the identification of early predictors of cognitive decline has important practical implications, especially if the predictors are modifiable. An exercise program that improves physical performance might also prevent or slow cognitive decline in older adults, particularly those with reduced grip strength. Lower handgrip strength may be an easy way to identify those patients most likely to benefit from a structured exercise program. Several randomized controlled trials have demonstrated that exercise programs for older adults improve both physical strength and cognitive function [29-31]. Other researchers, however, have found inconsistent results [32] suggesting the need for further investigations.
In the present study, serum IGF-1 positively correlated with HGS. IGF-1 is one of the most important mediators of muscle growth and muscle performance due to its anabolic signaling effect [33]. An age-dependent decline in IGF-1 serum levels and tissue responsiveness to IGF-1 is observed along with diminished efficiency in intracellular signaling [34]. Previous studies have shown an association between IGF-1 serum levels and functional outcomes in the elderly [35-37]. The decline in IGF-1 serum levels may promote frailty by contributing to the loss of muscle mass and strength. A significant positive correlation has been found between low plasma IGF-1 and functional outcomes, such as impaired physical performance and self-reported difficulties with mobility tasks [35].
The relationship between serum IGF-1 levels and HGS was detected only in male farmers. HGS and lower values for maximal muscle power and optimal shortening velocity were associated with lower circulating levels of IGF-1 only in women [34]. However, a significant difference was found between the previous study and this investigation in subjects and methods. In previous study, subjects were 65 years of age or older (mean age, 71.0 years in men, 70.6 in women). Because this study was performed on relatively young subjects (mean age, 58.7 years), the association between IGF-1 and muscle strength observed in the elderly may be absent. A difference in muscle strength was also observed. Previous studies were conducted using a lower extremity that deteriorates more rapidly with age than in the upper limbs. This study may lead to different outcomes because of differences in the study conducted in the upper extremities. Serum IGF-1 concentrations can also be affected by many factors. Estrogens and androgens are not only the direct determinants affecting the circulating IGF-1 concentrations, but also indirect determinants, which modulate the growth hormone (GH)/IGF-1 axis [38]. Serum concentrations of estrogens in postmenopausal women vary from those in menstruating women. Serum concentrations of androgens in men aged above 50 years may differ from those in men aged less than 50 years. Therefore, middle-aged adults undergo remarkable changes in their sex hormones, which may apparently influence the serum concentrations of IGF-1. Besides, sex hormonal changes proceed gradually in men compared with the sudden and fast changes that occur in women [39]. Therefore, the patterns of change in serum IGF-1 concentrations in men may be quite different from women. These gender differences in serum IGF-1 concentrations may explain the results of this study.
Increasing age is inversely related to HGS and that height and body weight correlate with HGS. This study was adjusted for age, height, and weight. Although this study attempted to assess the factors that influence grip strength, other factors, such as hand size, upper arm circumference, occupation, lifestyle, medications, nutritional status, and objective measures of physical and mental status may also be related to HGS. This study used a cross-sectional format, and therefore, associations between HGS and other variables could not be used to determine causality.
Despite this study’s limitations, sleep quality and attention level were more closely associated with HGS compared with other factors. A future longitudinal study with follow-up grip strength evaluation is required to generalize the findings of this study.