Effect of the Inspiratory Method and Timing of Voluntary Cough on Peak Cough Flow
Article information

Abstract
Objective
To define the effect of the inspiratory method and cough timing on peak cough flow (PCF).
Methods
We investigated the effect of measurement conditions on PCF in healthy subjects (n=10). We then compared obstructive and restrictive pulmonary diseases (n=20) to assess for similar results in respiratory diseases. The PCF was measured under four conditions: before coughing, without maneuver 1 or with maneuver 2 a temporary respiratory pause (4–6 seconds) after rapid inspiration, and without maneuver 3 or with maneuver 4 a temporary respiratory pause after slow inspiration. After the measurements were completed, the PCF between the four conditions was compared for each subject group, and the effect size was calculated.
Results
PCF of maneuvers 1 and 3 were significantly higher than maneuver 4 in healthy subjects (476.34±102.05 L/min and 463.44±107.14 L/min vs. 429.54±116.83 L/min, p<0.01 and p<0.05, respectively) and patients with restrictive pulmonary disease (381.96±145.31 L/min, 354.60±157.36 L/min vs. 296.94±137.49 L/min, p<0.01 and p<0.05, respectively). In obstructive pulmonary disease, maneuver 1 was significantly higher than maneuver 4 (327.42±154.73 L/min vs. 279.48±141.10 L/min, p<0.05). The largest effect sizes were shown by maneuvers 4 and 1.
Conclusion
PCF depends on changes in inspiratory speed before coughing and on temporary respiratory pauses after maximal inspiration. It will become necessary to unify the measurement methods for coughing strength and present appropriate coughing methods.

INTRODUCTION
Aspiration pneumonia and post-operative pulmonary complications are caused by impaired airway protection, particularly expectoration functions such as coughing. Coughing plays an essential role in airway defense to remove secretions and foreign substances from the airway and helps improve or prevent respiratory infections, atelectasis, and airway obstruction caused by sputum retention [1]. In recent years, peak cough flow (PCF) has been used as an objective measure of voluntary coughing ability, as reported in the literature [2-5]. The PCF can assess the motility aspect of the patient’s ability to produce a strong, forceful cough that is strong enough to clear foreign substances from the airways. Therefore, it can be used to predict expectorant ability in patients with neuromuscular and respiratory diseases.
It has been reported that patients with dysphagia do not develop pulmonary complications, such as aspiration pneumonia, with a PCF ≥242 L/min (sensitivity 77%, specificity 83%) [6]. Therefore, it appears that PCF is a prognostic predictor of respiratory function in patients with aspiration. In addition, a study on the relationship between neuromuscular diseases and coughing capacity reported that a PCF <160 L/min was significantly associated with the onset of pneumonia, a value at which intubation may also be considered [1,7]. Thus, the evaluation criteria for the PCF vary depending on its purpose.
Several studies on the clinical significance of voluntary PCF measurements have been reported in the literature. However, no common measurement method has been proposed to date.
However, higher values have been reported for forced vital capacity (FVC) and peak expiratory flow (PEF) for rapid inspiratory flow without respiratory pauses than for slow inspiratory flow followed by respiratory pauses for a few seconds [8]. Furthermore, these variables have been reported in healthy subjects and patients with respiratory diseases [9,10].
Cough differs from FVC and PEF in the compression phase, in which the glottis is closed and intrathoracic pressure increases, and in the elimination phase, in which the respiratory muscles eliminate air. However, these have been reported to correlate with PCF, which is measured by spirometry, peak flow meter, and PEF. Therefore, it appears that the PCF also varies according to differences in the inspiratory method and timing of coughing. Many studies on PCF have measured voluntary coughing from the maximum inspiratory point of the deepest and strongest possible coughing, with the subject deciding when to cough. To our knowledge, no study has investigated the inspiratory method and timing of coughing.
This study aimed to reveal the difference in PCF according to the methods of inspiration and timing of coughing and to investigate the differences in the measurement results between healthy subjects and patients with respiratory disease. In this study, we clarified the effects of the inspiratory method and timing of coughing on PCF. We believe that appropriate measurement methods can be used to measure PCF. Moreover, there is a possibility that expectoration availability might also vary depending on the method used if PCF differs. Therefore, we considered it possible to present the measurement of coughing ability and appropriate practice methods in coughing exercises and patient guidance situations, which could help in respiratory rehabilitation.
MATERIALS AND METHODS
Participants
As a primary study, the effects of measurement conditions on PCF were investigated in healthy subjects. Ten subjects were recruited to participate in the clinical study with a target number of ten subjects. The inclusion criteria were (1) never or light smokers (Brinkman index <100) >20 years and (2) those who were able to provide written consent to participate.
As a secondary study, 10 participants with obstructive pulmonary disease (OPD) and 10 with restrictive pulmonary disease (RPD) were included to investigate whether similar results could be observed in respiratory diseases. The inclusion criteria were as follows: (1) patients aged >20 years; (2) patients diagnosed with OPD or RPD; and (3) those who could provide written consent to participate in the study. The recruitment period for the primary and secondary study subjects was from February 2021 to March 2022.
The exclusion criteria for all subject groups were as follows: (1) unexplained blood expectoration; (2) angina pectoris; (3) unstable cardiovascular disease; (4) myocardial infarction or pulmonary embolism; (5) aortic aneurysm; (6) eye surgery (cataract or glaucoma); (7) chest or abdominal surgery; and (8) inability to provide informed consent due to cognitive or mental function.
The sample size was determined using G*Power 3.1.9.7 (Heinrich-Heine-Universität Düsseldorf, Düsseldorf, Germany). The number of participants was calculated assuming repeated-measures analysis of variance (significance level α=0.05, power 80%, effect size d=0.25), and the target number of subjects was 24. Therefore, 30 participants were included.
This study was approved by the Institutional Review Board of Gunma University Hospital (IRB No. 2020-079, approval number: 1868). The study information was published via the University Hospital Medical Information Network Clinical Trial Registration System (No. UMIN000043290).
Basic attribute
The participants’ ages, heights, and weights were obtained through interviews or medical record data. Body mass index and body surface area (BSA) were calculated. BSA was calculated using weight (kg)0.362×height (cm)0.833×53.189×10-4 for males and weight (kg)0.445×height (cm)0.627 for females, as reported by Kurazumi et al. [11].
Hand grip strength
Grip strength was measured as an indicator of wholebody muscle strength. A Smedley digital grip strength meter (T.K.K.5401 GRIP D; Takei Scientific Instruments Co., Ltd., Niigata, Japan) was used to measure the grip strength. The grip was adjusted with the second finger 90° to the second joint. Measurements were performed with the arms down naturally, and the grip strength meter was held without touching the body or clothing. Two measurements were performed alternately on the left and right sides, and the average of the highest values on each side was used as grip strength.
Pulmonary function test
A physical therapist performed pulmonary function tests using a spirometer. The American Thoracic Society and European Respiratory Society guidelines [12] indicate that PEF decreases when inspiration is slow or when there is a 4–6 second pauses in total lung capacity before expiration begins. Therefore, we used a method that requires fast inspiration and minimal pauses (1–2 seconds) during full inspiration. The FVC, percent predicted FVC (%FVC), forced expiratory volume in one second (FEV1), percent predicted FEV1 (%FEV1), FEV1 as a percentage of FVC (FEV1/FVC), %FEV1/FVC, PEF, percent predicted PEF, FEV in 75%–25% (V75–V25), and percent predicted V75–V25 were calculated using a spirometer. The practice was performed two to three times, followed by three measurements, and the one with the maximum FVC was used.
Cough ability and measurement condition
PEF, which has been reported to correlate with PCF, was set up with the following measurement conditions and reported to show variation in the measured values [8-10]. Therefore, four measurement conditions were established in this study based on previous studies.
Maneuver 1 (M1): coughing without an end-inspiratory pause after fast inspiratory
Maneuver 2 (M2): coughing with an end-inspiratory pause after fast inspiratory
Maneuver 3 (M3): coughing without an end-inspiratory pause after slow inspiratory
Maneuver 4 (M4): coughing with an end-inspiratory pause after slow inspiratory
For all PCF measurements, we asked the patients to perform voluntary coughing from the maximal inspiratory position to the maximum of their ability, telling them, “inhale the largest breath you can and cough the strongest you can”. In addition, fast inspiration was explained in the same manner as in the pulmonary function test: “take a large breath as quickly as possible”. For slow inspiration, the subject was asked to inhale slower than during the pulmonary function test and to “take a slow, large breath”. When explaining the measurement conditions, a flow-volume curve of the inspiratory phase was presented so the subject could understand the changes in the inspiratory speed. Before coughing, the maximum inspiratory flow rate (peak inspiratory flow [PIF]) was also measured to characterize the inspiratory speed for each condition. Feedback was provided after each explanation of each condition.
For an end-inspiratory pause, the subject watches a timer and coughs after a 4–6 second respiratory pauses [8-10].
The use of a mouthpiece was considered to have the potential to cause air leakage because the measurement maneuvers were not performed in a normal pulmonary function test. Therefore, the PCF-measuring device used was a spirometer with a face mask. The face mask was placed close to the face to prevent air leakage. Measurements were performed in a sitting position or, if unstable, while the patient was seated in a wheelchair or chair. The participants were instructed not to assume a hunchback position during the measurements. The practice was performed two to three times, followed by three measurements. The maximum measurement was used.
Statistical analysis
The basic attributes and respiratory function parameters of each subject group were checked for normality using the Shapiro–Wilk test and then confirmed for significance using a one-way analysis of variance.
The Shapiro–Wilk test was used to check for normality for each of the four conditions in each group. Then, the PCF between the four conditions was compared using a repeated-measures analysis of variance. The significance of the differences between the groups was examined using multiple comparison tests. In addition, effect sizes were calculated for each condition. The same statistical analysis was performed for mean PIF. Statistical analyses were conducted using IBM SPSS Statistics version 26.0 (IBM Corp., Armonk, NY, USA), and the significance level was set at a p-value of <0.05.
RESULTS
Participants characteristics
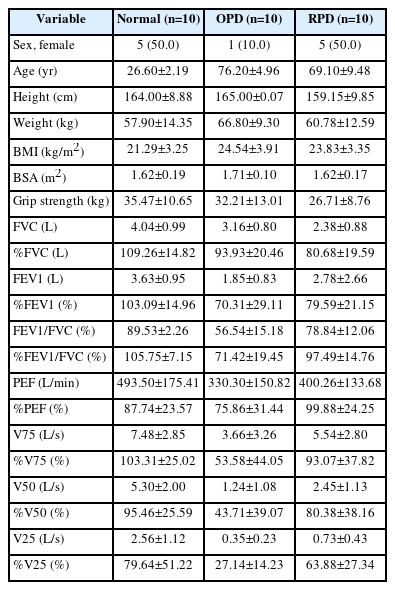
Thirty participants were analyzed: ten healthy participants (normal), 10 with OPD, and 10 with RPD. Regarding the proportion of subjects by sex, 50% of the normal group, 10% of the OPD group, and 50% of the RPD group were female. The normal group was significantly younger (26.60±2.19 years), while the OPD and RPD groups were significantly older (76.20±4.96 years, 69.10±9.48 years). Detailed descriptions are provided in Table 1.
Basic attributes and pulmonary function test parameters for each group
In the OPD group, all ten patients had chronic obstructive pulmonary disease (COPD), classified as Global Initiative for Chronic Obstructive Lung Disease (GOLD) I in 5, GOLD II in 2, GOLD III in 2, and GOLD IV in 1 [13]. In the RPD group, 4 cases of interstitial pneumonia due to collagen diseases, 2 cases of idiopathic pulmonary fibrosis (IPF), and 4 cases of idiopathic interstitial pneumonia, except for IPF, were included.
Pulmonary function test
All subjects in the normal group fulfilled %FVC ≥80% and FEV1/FVC ≥70% on the pulmonary function tests. The OPD group fulfilled the criteria for obstructive ventilation disorder on pulmonary function tests (FEV1/ FVC <70%) and showed low values for PEF and V75, indicators of central airway obstruction, and V50 and V25, indicators of peripheral airway obstruction. In contrast, the RPD group did not fulfill the criteria for restrictive ventilation disorder on respiratory function tests (%FVC <80%), and the FVC value of the subjects was relatively high. Detailed descriptions are provided in Table 1.
Comparison of the mean peak cough flow between the four coughing conditions
Normal
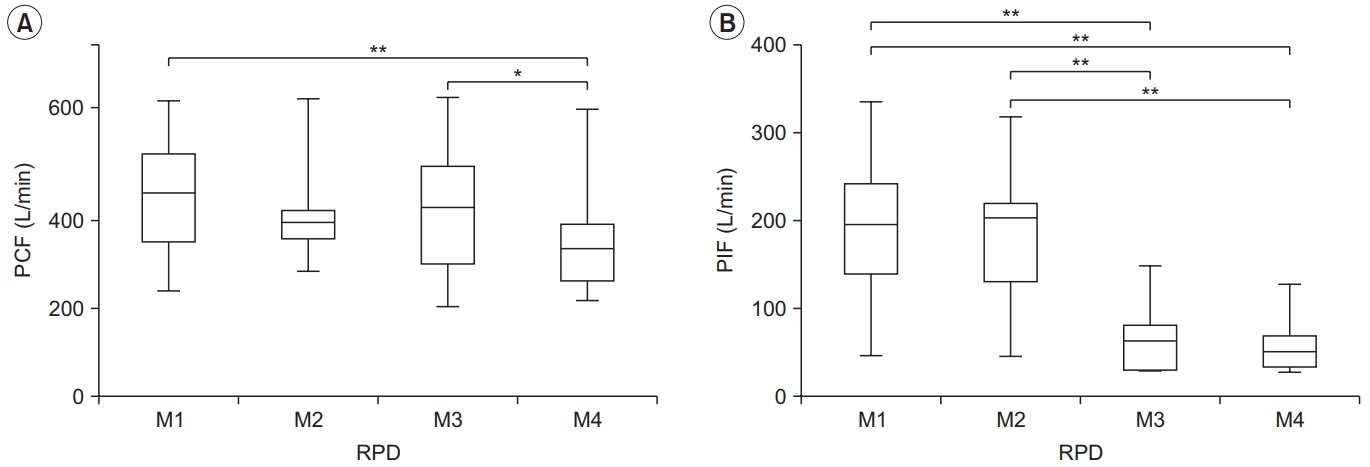
In the normal group, the mean PCF was significantly higher in M1 and M3 than in M4 (476.34±102.05 L/min and 463.44±107.14 L/min vs. 429.54±116.83 L/min, p<0.01 and p<0.05). However, there were no significant differences among the other conditions. The effect size between the four conditions was largest for M1 (Cohen’s d=0.39, effect size r=0.19) among M4 and the groups for which the effect sizes were calculated (Table 2, Fig. 1). In addition, the highest PCF for M1 was found in seven of the 10 subjects.
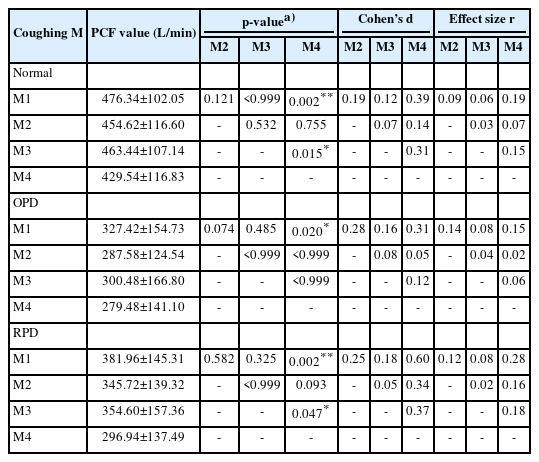
Measured and comparison of PCF values between the four conditions
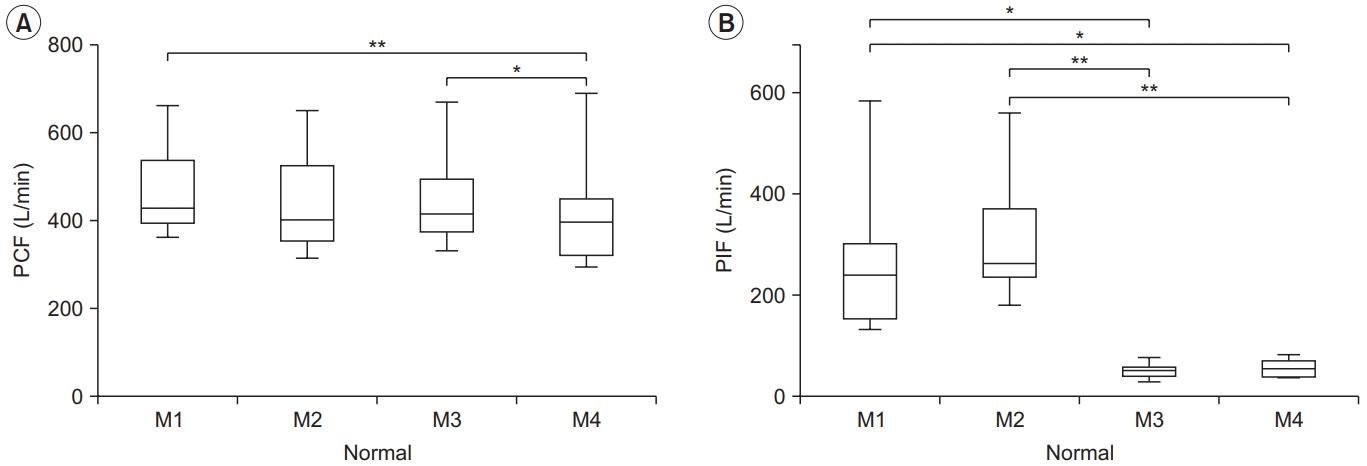
Peak cough flow (PCF) (A) and peak inspiratory flow (PIF) (B) for each condition in the normal group. PCF differed significantly between M1–M4 and M3–M4, and PIF differed between M1–M3, M1–M4, M2–M3, and M2–M4. The lower and upper margins of the box represent the lower quartile (Q1) and upper quartile (Q3) of the total score, respectively. The band inside the box indicates the median, and the whiskers range from Q1+1.5 interquartile range (IQR) to Q3+1.5 IQR. The horizontal lines above the box graph depict significant differences using Bonferroni correction (*p<0.05, **p<0.01). M, maneuver.
Obstructive pulmonary disease
The OPD group showed a higher PCF in M1 than in M4 (327.42±154.73 L/min vs. 279.48±141.10 L/min, p<0.05). However, there were no significant differences among the other conditions. The effect size between the four conditions was the largest for M1 (Cohen’s d=0.31, effect size r=0.15), which was similar to that of the normal group (Table 2, Fig. 2). In addition, the highest PCF for M1 was found in six of the 10 subjects.
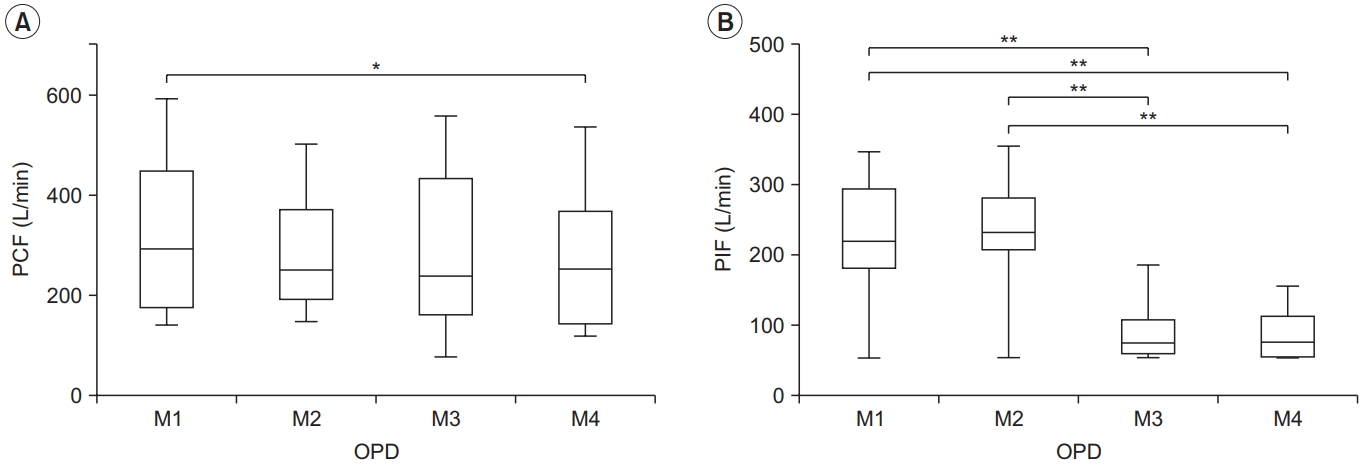
Peak cough flow (PCF) (A) and peak inspiratory flow (PIF) (B) for each condition in the obstructive pulmonary disease (OPD) group. PCF differed significantly between M1–M4, and PIF differed between M1–M3, M1–M4, M2–M3, and M2–M4. The lower and upper margins of the box represent the lower quartile (Q1) and upper quartile (Q3) of the total score, respectively. The band inside the box indicates the median, and the whiskers range from Q1+1.5 interquartile range (IQR) to Q3+1.5 IQR. The horizontal lines above the box graph depict significant differences using Bonferroni correction (*p<0.05, **p<0.01). M, maneuver.
Restrictive pulmonary disease
The RPD group showed a higher PCF in M1 and M3 than in M4 (381.96±145.31 L/min, 354.60±157.36 L/min vs. 296.94±137.49 L/min, p<0.01 and p<0.05), it was similar to that of the normal group. However, there were no significant differences among the other conditions. The effect size between the four conditions was the largest for M1 (Cohen’s d=0.60, effect size r=0.28). This was the same for all subject groups (Table 2, Fig. 3). In addition, the highest PCF for M1 was found in five of the 10 subjects.
Peak cough flow (PCF) (A) and peak inspiratory flow (PIF) (B) for each condition in the restrictive pulmonary disease (RPD) group. PCF differed significantly between M1–M4 and M3–M4, and PIF differed between M1–M3, M1– M4, M2–M3, and M2–M4. The lower and upper margins of the box represent the lower quartile (Q1) and upper quartile (Q3) of the total score, respectively. The band inside the box indicates the median, and the whiskers range from Q1+1.5 interquartile range (IQR) to Q3+1.5 IQR. The horizontal lines above the box graph depict significant differences using Bonferroni correction (*p<0.05, **p<0.01). M, maneuver.
Comparison of the mean peak inspiratory flow between the four coughing conditions
The PIF was higher for fast inspiration in M1 and M2 than for slow inspiration in M3 and M4. In addition, no significant differences were found between M1 and M2, or between M3 and M4, suggesting that the change in inspiratory speed during the measurement period was sufficient (Table 3, Figs. 1-3).
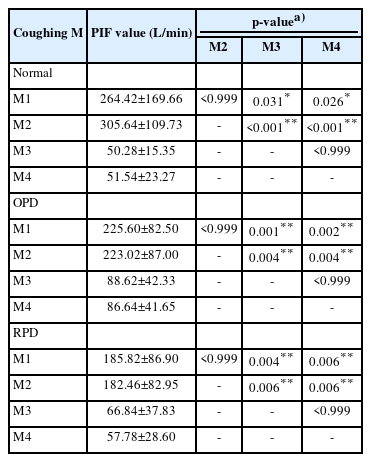
Measured and comparison of PIF values between the four conditions
DISCUSSION
The results of this study suggest that PCF is significantly affected by inspiratory speed before coughing and respiratory pauses. Comparisons between the four coughing conditions showed higher PCF values for M1 than for M4 in all the groups. In addition, the effect size calculated from M4 was the highest for M1, and this trend was observed in all subject groups. D’Angelo et al. [8] found that a change in inspiratory speed before maximal expiration and a temporary respiratory pause affected the measured values of PEF, which is correlated with PCF. Furthermore, this trend has been reported in healthy subjects and patients with COPD and RPDs [9,10]. These reports suggest a trend similar to that observed in the present study. Therefore, the results of the present study suggest that PCF may be higher in coughs without temporary respiratory pauses after fast inspiration. The determinants of PCF are age, thoracic expansion, and respiratory muscle strength [14]. In addition, pulmonary function tests, such as FVC, FEV1, and maximum insufflation capacity, have been reported to be determinants [15]. However, the findings of this study provide empirical evidence for previously reported facts. Each patient should be guided to find a method of inspiration that will enable them to achieve the highest air capacity.
There are three possible factors by which inspiratory speed and respiratory pauses can affect the PCF.
First, according to D’Angelo et al. [8], the viscoelastic elements of the lung and thorax are responsible for the tension between the chest wall and lung tissue. This element influences the highly elastic lung tissue and chest wall recoil caused by the rapid inspiratory flow. On the other hand, slow inspiratory flow is associated with lower elastic recoil than rapid flow. Furthermore, expiratory flow volume has been reported to vary depending on the temporary respiratory pause owing to the stress relaxation phenomenon, in which the respiratory pause lowers the pulmonary elastic recoil pressure before expiration. Tzelepis et al. [16] reported elastic recoil pressure variations during rapid or slow inspiration and with or without temporary respiratory pauses post-inspiration, using estimated intrathoracic pressures from intra-esophageal pressures measured using the esophageal balloon technique. They found that elastic recoil pressure at maximal expiration was significantly negative in the method of rapid inspiratory pressure without temporary respiratory pause compared to the method with slow inspiratory pressure followed by a temporary pause. This suggests that the viscoelastic elements of the lungs and chest wall and the stress relaxation phenomenon also affected PCF in the present study and that PCF varied with different inspiratory methods and timing of coughing.
Second, in obstructive and RPDs, conditions such as central and peripheral airway obstruction and interstitial thickening of the alveolar walls lead to a reduction in local lung extensibility. It has been reported that the time constant in the pulmonary artery, which is determined by the product of compliance and resistance, is unequal, and the volume of ventilation varies among the regions of the pulmonary artery, resulting in changes in expiratory volume [8-10,14]. In the present study, this intrapulmonary time-constant inequality may have affected the recruitment of alveoli with higher ventilatory efficiency during rapid inspiratory exercise before coughing. On the other hand, slow inspiration or post-inspiratory pauses may have decreased PCF. However, D’Angelo et al. [17] studied the variability of expiratory volume in patients with COPD and bronchial asthma after the administration of bronchodilators and inhalation of oxygen-helium gas mixtures under the same measurement conditions as in the present study. The results showed that PEF was significantly higher in the case of rapid inspiration without respiratory pause at end-inspiration than in the case of slow inspiration with a pause of approximately 5 seconds at end-inspiration. Helium is a low-density gas that is less likely to cause airway disturbances, and in oxygen-helium mixtures, it suppresses peripheral airway resistance [18]. In addition, the above study used bronchodilators, and the high airway resistance and unequal intrapulmonary time constants observed in patients with COPD and bronchial asthma were equally measured. However, the authors reported that the expiratory volume was significantly higher when rapid inspiration without respiratory pauses was used. Therefore, D’Angelo et al. [17] suggested that airway obstruction and inequality of intrapulmonary time constants may have little effect on the variation in PCF with inspiratory speed and with or without respiratory pauses before coughing. Further studies are required to confirm this hypothesis.
Third, in skeletal muscles, a property called the stretchshortening cycle (SSC) has been reported, in which the performance of the main movement is enhanced by applying a quick pre-stretch in the opposite direction to the movement before the main movement [19,20]. The effects of SSC have been reported, such as the elastic energy accumulated during extension muscle activity being recycled in contraction muscle activity and the stretch reflex activity induced by muscle stretch, enhancing the activity of the main active muscle. The effects of SSC have also been reported in the respiratory muscles. Tzelepis et al. [16] used the maximal esophageal pressure (Pesmax) during the expiratory phase and surface electromyography (EMG) of the abdominal and pectoral muscle groups as indices to examine changes in inspiratory flow before maximal expiration and variations in expiratory muscle activity with and without respiratory pauses. The results reported that the Pesmax and EMG of the abdominal and pectoralis muscle groups during the expiratory phase were significantly higher in the rapid inspiratory pause group than in the slow inspiratory pause group. Similar to the report by Tzelepis et al. [16] and the present study, Zakynthinos et al. [21] investigated the differences in the maximal inspiratory mouth pressure (PImax) and surface EMG of the pectoralis muscle group under the measurement conditions of a change in expiratory flow before maximal inspiratory and respiratory pauses before the inspiratory phase. They reported that PImax and EMG of the pectoralis muscle group were significantly higher during rapid expiration without end-expiratory pauses than during slow expiration with end-expiratory pauses. These reports suggest that SSC also affects the respiratory muscles. These studies may indicate that SSC of the respiratory muscles affected PCF in this study and that PCF may have differed depending on the change in inspiratory speed and respiratory pause before coughing.
Discussion of each subject group
Normal
In the case of the normal group, the PCFs of M1 and M3 were significantly higher than those of M4. In addition, M1 had the largest effect size compared with M4, followed by M3. Therefore, the present study suggests that PCF in healthy subjects is affected by respiratory arrest before coughing, which may be due to the decrease in elastic recoil associated with respiratory arrest and the lack of an effect of SSC. However, since the present study was conducted on healthy young subjects, it is possible that the measured values would change in healthy older participants. Older people may show symptoms such as age-related decline in respiratory muscle and diaphragm function, decreased compliance owing to stiffening of the thorax, or hyperinflation of the lungs [22]. Therefore, it is assumed that more significant changes in the PCF obtained by changing the pre-coughing method will occur than in the present results. In the future, age-related validation should be performed.
Obstructive pulmonary disease
In the case of OPD, the PCF of M1 was significantly higher than that of M4, which was different from that of the Normal and RPD groups. Air trapping is typical in patients with COPD owing to airway obstruction. Therefore, a temporary breath hold before coughing can also cause less airflow to enter the alveoli. This results in a more pronounced change in the PCF.
Patients with COPD have been described as showing impaired ventilation distribution because of changes in both the airways and lung parenchyma. Flow limitation is caused by the inflammation of the small airways, which alters their viscoelastic properties. In addition, a decrease in the elasticity of the lung parenchyma is caused by a decrease in alveolar function, resulting in a decrease in pulmonary elastic recoil pressure [23,24]. Therefore, the slow inspiration method resulted in a lower elastic recoil pressure, a trend that may differ from that of normal and RPD. Boni et al. [25] investigated the effects of preceding inspiratory velocity and respiratory pauses on a forced expiratory maneuver in healthy subjects and patients with COPD. They reported that unless the receding inspiratory velocity was longer than 2 seconds, it did not affect PEF and FEV1 in either healthy subjects or patients with COPD. Based on this report, examining the influence of inspiratory duration on PCF measurement is necessary.
Restrictive pulmonary disease
The change in the PCF in the RPD due to the precoughing maneuver was similar to that in the normal group. However, the effect size calculated from M4 and M1 was the largest for each subject group. These results suggest that the change in the inspiratory rate before coughing and a temporary respiratory pause significantly affects PCF in interstitial pneumonia and pulmonary fibrosis, the diseases studied in this study. The main pathophysiology of these diseases is inflammation and fibrosis of alveolar walls. Therefore, it is suggested that the effect of respiratory arrest after slow inspiration on PCF increases in restrictive lung diseases. This is because fewer alveoli were used for ventilation than in the other groups. Furthermore, since %FVC was relatively high in the RPD group in the present study, more pronounced changes may occur in patients with more severe restrictive lung disease than in the present study. Further studies are required to confirm this hypothesis.
Limitations
This study has several limitations. The present study revealed significant variations in the PCF in relation to altered inspiratory speed and respiratory pauses before coughing. These factors have been reported to be affected by the viscoelastic elements of the pulmonary and thoracic walls, inequality in pulmonary time constants, and SSC activation of the respiratory muscles. However, this study evaluated changes in lung volume and ventilation flow rate using spirometry, and the causes of the variation in PCF depending on the measurement conditions were only speculative. To investigate the variation in PCF in more detail, studies that examine changes in intra-esophageal pressure, respiratory muscle assessment by intra-oral pressure, and electromyographic evaluation in response to coughing conditions are necessary.
In the present study, variations in PCF were observed in response to alterations in PIF, and these variations were similar between healthy subjects and patients with respiratory diseases. However, comparisons between patients with respiratory disease and PCF alterations with PIF changes have not been reported. Furthermore, PIF is generally used to assess whether an adequate inspiratory flow rate has been achieved with the use of inhaled medicines in patients with bronchial asthma and COPD and to provide guidance on inspiration methods. Therefore, the PIF has not yet been established as an indicator of inspiratory speed before coughing. The results of this study suggest that the inspiratory phase of coughing should also be considered. Therefore, a detailed study of the relationship between PIF and PCF is required.
In conclusion, the results of this study suggest that changes in the method of inspiration before coughing and temporary respiratory pauses can cause variations in the PCF. Furthermore, our results suggest that the PCF measurement method should be standardized and that appropriate PCF measurement and coughing education tools should be provided, considering that coughing power changes according to inspiratory speed and respiratory pauses.
Finally, respiratory diseases, cancer, cardiovascular and cerebrovascular diseases, and pathological conditions such as aspiration pneumonia and frailty can decrease the expectoration and coughing capacity. Before the results of the present study can be used as a guide for respiratory rehabilitation, it is necessary to evaluate and compare the coughing ability under coughing conditions for the abovementioned diseases.
Notes
No potential conflict of interest relevant to this article was reported.
None.
Conceptualization: Kotajima F, Hisada T. Formal analysis: Kotajima F. Methodology: Kotajima F, Yatomi M, Hisada T. Project administration: Kotajima F, Yatomi M, Hisada T. Visualization: Kotajima F, Hisada T. Writing – original draft: Kotajima F. Writing – review and editing: Kotajima F, Yatomi M, Hisada T. Approval of the final manuscript: all authors.