A Single Bout of Constant-Load Exercise Test for Estimating the Time Constant of Oxygen Uptake Kinetics in Individuals With Stroke
Article information

Abstract
Objective
To examine the relationship between the time constant of oxygen uptake kinetics during the onset of exercise (τVO2) estimated from a single exercise bout and that obtained from three averaged exercise bouts in individuals with stroke.
Methods
Twenty participants with stroke performed three bouts of a constant-load pedaling exercise at approximately 80% of the workload corresponding to the ventilatory threshold to estimate τVO2. The VO2 data from the first trial of three bouts were used to estimate τVO2 for a single bout. Additionally, data collected from three bouts were ensemble-averaged to obtain τVO2 for three averaged bouts as the criterion.
Results
There was a very high correlation between τVO2 for a single bout (34.8±14.0 seconds) and τVO2 for three averaged bouts (38.5±13.4 seconds) (r=0.926, p<0.001). However, τVO2 for a single bout was smaller than that for three averaged bouts (p=0.006).
Conclusion
τVO2 for a single bout could reflect the relative difference in τVO2 for three averaged bouts among individuals with stroke. However, it should be noted that τVO2 for a single bout may be underestimated compared to τVO2 for three averaged bouts.
INTRODUCTION
Negative physiologic adaptations, such as impaired hemodynamic response, respiratory dysfunctions, and muscle atrophy are observed in individuals with stroke [1]. These changes can affect the health status and daily activities after stroke. Therefore, assessment of the cardiorespiratory response to exercise is essential for the purpose of determining exercise capacity, training prescription, treatment efficacy evaluation, and/or investigation of exercise-induced adaptations of the oxygen transport/utilization system in individuals with stroke [2].
Transient responses of oxygen uptake (VO2) kinetics to a constant-load exercise at an intensity below the ventilatory threshold are classified into three phases. The time constant of VO2 kinetics in phase 2 (τVO2) represents the speed of the mono-exponential increase in VO2 toward a steady state level, which reflects the ability of the cardiopulmonary system to deliver and the skeletal muscles to utilize the increased level of oxygen needed for aerobic metabolism [3]. A greater τVO2 is associated with poor health status, aging, and physical deconditioning [4-8]. τVO2 in individuals with stroke has been reported to be larger than that in healthy adults [9,10], which is caused by an impairment of the oxygen delivery system rather than the mechanism of oxygen utilization [11]. In addition, a larger τVO2 is associated with fewer daily walking steps in these individuals [12].
VO2 data during exercise onset are fitted to a monoexponential model to estimate τVO2 [4]. Breathing typically has inherent irregularities that can result in breathto-breath fluctuations in gas exchange. Therefore, VO2 data obtained from multiple repeated bouts of exercise are ensemble-averaged to improve the goodness of fit for mono-exponential modelling that is reported as the 95% confidence interval (CI) for τVO2 [13-15]. Although averaging the VO2 transition of at least three exercise bouts has been considered necessary to estimate τVO2 [13,15,16], increasing the number of exercise repetitions corresponds to an increase in the burden on participants and in the time required to complete an exercise test. As a single exercise bout can minimize the testing burden, it may be desirable for persons who have difficulty in completing the multiple bouts of exercise. A single bout and three repeated bouts of exercise have been carried out to assess VO2 kinetics in individuals with stroke [9,10,12,17]. However, it has not been reported whether τVO2 estimated from a single exercise bout can reflect the relative difference in τVO2 obtained from three averaged bouts in individuals with stroke. Previous experimental and simulation studies of healthy adults reported that the estimates of τVO2 were not changed [13] or progressively decreased [15,16] as the number of averaged exercise bouts increased from one to three, although the reason for the decrease in τVO2 was not determined. As cardiorespiratory responses to exercise differ between individuals with stroke and healthy adults [9,18,19], understanding the influence of averaging multiple exercise bouts on the estimates of τVO2 in individuals with stroke will help clinicians working in stroke rehabilitation to determine the number of exercise bouts for estimating the τVO2 of their patients.
Hence, the present study aimed to determine the relationship between τVO2 estimated from a single bout and that obtained from the average of three exercise bouts in individuals with stroke. We hypothesized that τVO2 estimated from a single exercise bout would be strongly correlated with but greater than that obtained from the average of three exercise bouts, considering the findings of previous studies that examined the influence of averaging multiple exercise bouts on τVO2 in healthy adults [13,15,16].
MATERIALS AND METHODS
Study design
The study protocol was approved by the ethics committees of Tokyo Bay Rehabilitation Hospital (Approval No. 172-2) and Shinshu University (Approval No. 3813). All participants provided written informed consent prior to their enrolment in the study.
Participants
Participants with stroke were recruited from a subacute rehabilitation ward from January 2018 to March 2020. The diagnosis was confirmed based on computed tomography findings. The inclusion criteria were as follows: (1) age 40–80 years, (2) the first-ever stroke occurred within 180 days, (3) ability to maintain a target cadence of 50 rpm during exercise, and (4) Mini-Mental State Examination score ≥24 [20]. The exclusion criteria were as follows: (1) limited range of motion and/or pain that could affect exercise test performance; (2) unstable medical conditions, such as unstable angina, uncontrolled hypertension, or tachycardia; (3) use of beta-blockers; and (4) any comorbid neurological disorders.
Procedure
On the first day, participants performed a symptomlimited graded exercise test to determine the workload for a submaximal exercise test. Within a week after the symptom-limited graded exercise test, the submaximal constant-load exercise test was performed at approximately 80% of the workload corresponding to the ventilatory threshold [9].
Exercise testing
Participants were instructed to refrain from food consumption for 3 hours, caffeine intake for at least 6 hours, and vigorous physical activity for 24 hours prior to the exercise test [21]. Exercise testing was performed on a recumbent cycle ergometer (Strength Ergo 240; Mitsubishi Electric Engineering Co. Ltd., Tokyo, Japan). Participants were instructed to maintain a target cadence of 50 rpm during the symptom-limited graded and submaximal constant-load exercise tests [21].
All participants rested for 5 minutes before measurements were obtained. The symptom-limited graded exercise test started with a warm-up at 10 W for 3 minutes, followed by an increment of 10 W every minute [21]. The test was terminated if a participant exhibited signs of angina, dyspnea, inability to maintain a cycling cadence of ≥40 rpm, hypertension (>250 mmHg systolic or >115 mmHg diastolic), or a decrease in systolic blood pressure by >10 mmHg despite the increase in workload [22,23]. Expired gas was measured on a breath-by-breath basis using an expired gas analyzer (Aerosonic AT-1100; ANIMA Corp., Tokyo, Japan). Prior to expired gas data collection, the analyzer was calibrated using gas mixtures with accurately known concentrations of oxygen and carbon dioxide.
The ventilatory threshold was identified using a combination of the following criteria: (1) the point of deflection of carbon dioxide output versus VO2 (V-slope method), (2) the point at which the ventilatory equivalent of oxygen reaches its minimum or starts to increase, without an increase in the ventilatory equivalent of carbon dioxide, and (3) the point at which the end-tidal oxygen fraction reaches its minimum or starts to increase, without a decrease in the end-tidal carbon dioxide fraction [24]. The V-slope method was prioritized when all three criteria yielded different results [25]. The first threshold was determined as the average of values provided by two independent raters (JM and YI), when the difference in VO2 values of the corresponding points, as determined by the two raters, was <100 mL/min. In case of any discrepancy, a third experienced rater (KO) judged the point, and the first threshold was taken as the average of the two closest values [26].
The submaximal constant-load exercise test consisted of three 6-minute periods of pedaling at 80% of the workload corresponding to the ventilatory threshold, with a rest between each repetition. The first trial of three exercise bouts was preceded by a 3-minute resting period.
Data fitting
Occasional errant VO2 values due to coughing, swallowing, or talking were first deleted from the dataset when VO2 exceeded 3 standard deviations of the local mean, defined as the average of 2 subsequent breaths and 2 preceding breaths [14]. Data from individual trials were interpolated on a second-by-second basis and timealigned such that the onset of exercise corresponds to 0 second [15,27]. The interpolated data from the first trial of three exercise bouts were used to estimate VO2 kinetics parameters for a single exercise bout. In addition, the interpolated data collected from three exercise bouts were ensemble-averaged to obtain VO2 kinetics parameters for three averaged bouts as the criterion. The first 20 seconds of data after exercise onset was eliminated, as the increase in VO2 during this period merely reflects the increase in pulmonary blood flow rather than changes in tissue gas exchange [4,15]. To estimate τVO2, nonlinear least squares regression with GraphPad Prism software for Windows version 7.00 (GraphPad Software, San Diego, CA, USA) was applied to the onset phase using monoexponential functions with the following format:
Onset kinetics: VO2(t) = baseline VO2 value + A × (1 − exp−(t − TD)/τ)
where VO2(t) represents VO2 at a given time (t); A, the amplitude of the increase in VO2 above the baseline value; TD, the time delay; and τ, the time constant. The baseline VO2 value was defined as the average VO2 during the last minute of the resting period, whereas the steady-state VO2 value referred to the average VO2 during the last minute of exercise. The goodness of fit for mono-exponential modelling was evaluated as the 95% CI for τVO2. A narrower 95% CI for τVO2 reflects a smaller signal noise [13,15,27].
Statistical analysis
G*Power software version 3.1.9.2 (Heinrich-Heine-Universitat, Dusseldorf, Germany) was used for sample size calculation [28]. Previous experimental studies of healthy adults compared the VO2 kinetics parameters among different number of averaged exercise bouts in eight to nine participants [13,16]. For correlation analysis, as we hypothesized a strong correlation between τVO2 estimated from a single exercise bout and that obtained from the average of three exercise bouts, we used an estimated effect size of 0.70 (very large) [29]. In addition, considering a statistical power of 0.95 and an alpha level of 0.05, the required sample size was estimated at 16.
Data normality was assessed using the Shapiro-Wilk test, which determined that the assumption of normality was met for the VO2 kinetics parameters (p>0.05). Pearson product-moment correlation coefficient was used to examine the correlation of the VO2 kinetics parameters, including the baseline VO2 value, the amplitude of the increase in VO2 during onset exercise, time delay, and τVO2, between a single bout and three averaged bouts. Correlations were categorized as negligible (|r|<0.3), low (0.3≤|r|<5.0), moderate (0.5≤|r|<0.7), high (0.7≤|r|<0.9), and very high (0.9≤|r|) [30]. When a high to very high correlation of τVO2 existed between a single bout and three averaged bouts, we additionally performed a liner regression analysis to obtain an equation that converted τVO2 estimated from a single exercise bout to that obtained from the average of three exercise bouts. A paired t-test was used to compare the VO2 kinetics parameters and the 95% CI for τVO2 between different numbers of averaged exercise bouts. We also used one-way repeated measures analysis of variance, followed by a paired t-test with Bonferroni correlation to investigate whether the VO2 kinetics parameters and the 95% CI for τVO2 changed during repeated trials. Statistical analyses were conducted using GraphPad Prism software for Windows version 7.00 (GraphPad Software, San Diego, CA, USA). Any p-values <0.05 were considered to indicate statistical significance.
RESULTS
Participants
A flow chart describing participant enrolment for this study is shown in Fig. 1. A total of 23 participants performed the symptom-limited graded and submaximal constant-load exercise tests. Expired gas during the submaximal constant-load exercise test could not be measured in three participants because of technical difficulties. Consequently, 20 participants were included in the analysis. The participants’ characteristics are summarized in Table 1.
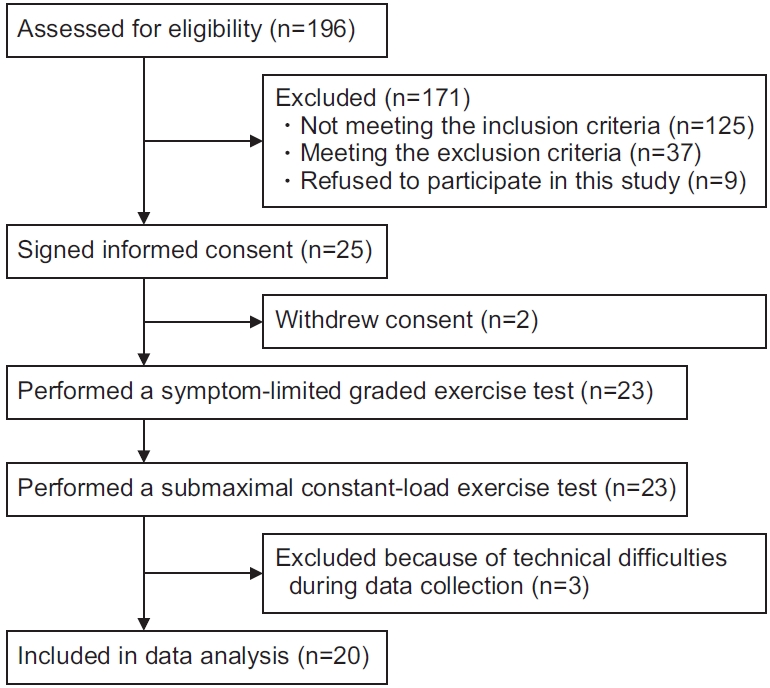
Flow chart of study participants.

Participants’ characteristics
Exercise testing
No serious adverse events occurred during or after the symptom-limited graded and submaximal constant-load exercise tests. All participants had to stop performing the symptom-limited graded exercise test because of their inability to maintain a cycling cadence of >40 rpm. The ventilatory threshold was determined in all participants. The mean VO2 at the ventilatory threshold was 14.7±2.7 mL/kg/min, and the median work rate corresponding to approximately 80% of VO2 at the ventilatory threshold was 10.0 W (interquartile range, 10.0–17.5 W).
The representative VO2 responses during exercise onset obtained from a single bout and three averaged bouts are shown in Fig. 2. In addition, the measurement values of VO2 kinetics parameters and the 95% CI for τVO2 are presented in Table 2.
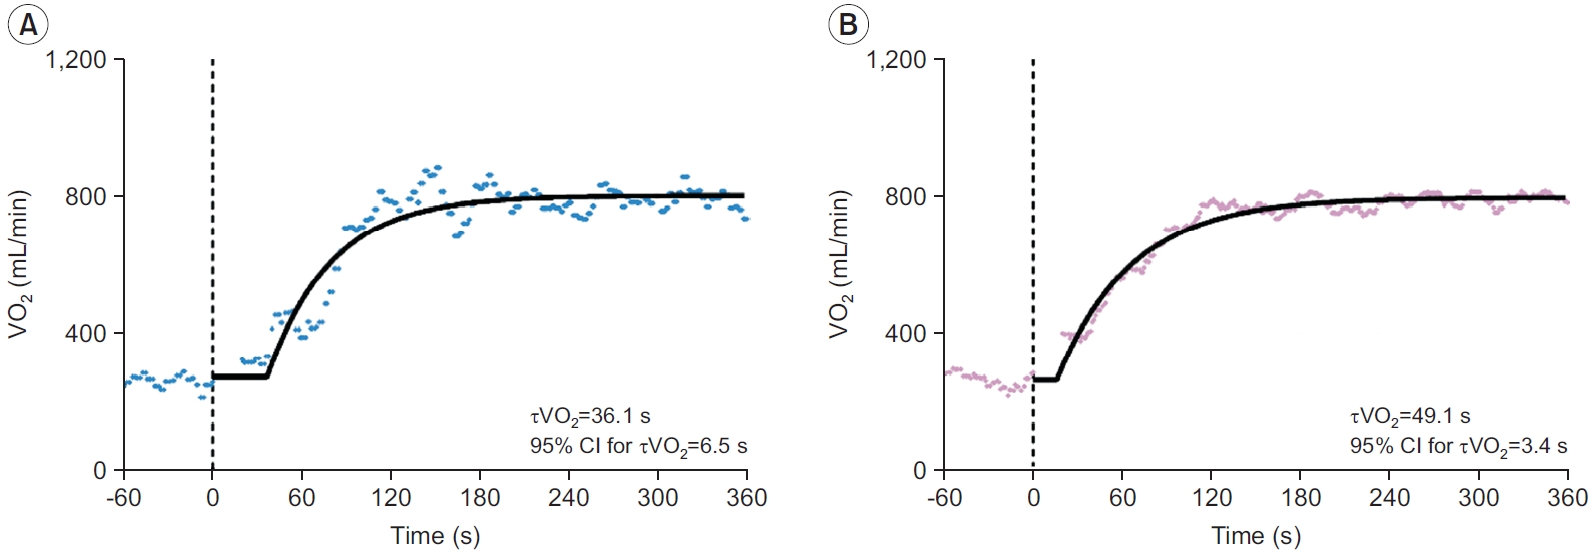
Typical oxygen uptake kinetics during exercise onset obtained from a single bout (A) and the average of three exercise bouts (B). Model fits on the data are displayed with a solid line. The vertical dashed line indicates the onset of exercise. CI, confidence interval; τVO2, time constant of oxygen uptake kinetics; VO2, oxygen uptake.

Comparisons of oxygen uptake kinetics parameters and the 95% CI between a single exercise bout and three averaged exercise bouts
Correlations between VO2 kinetics parameters estimated from a single bout and the average of three exercise bouts
There was a high to very high correlation between a single bout and three averaged exercise bouts for the baseline VO2 value (r=0.853; 95% CI, 0.660–0.941; p<0.001) (Fig. 3A), the amplitude of the increase in VO2 (r=0.974; 95% CI, 0.935–0.990; p<0.001) (Fig. 3B), the time delay (r=0.792; 95% CI, 0.537–0.914; p<0.001) (Fig. 3C), and τVO2 (r=0.931; 95% CI, 0.831–0.973; p<0.001) (Fig. 3D). The linear regression analysis revealed the following equation to convert τVO2 estimated from a single exercise bout to that obtained from the average of three exercise bouts: τVO2 for three averaged bouts = 0.887 × τVO2 for a single bout + 7.618 (R2=0.857, p<0.001).

Correlations between a single bout and three averaged exercise bouts for the baseline VO2 value (A), the amplitude of increase in VO2 (B), the time delay (C), and τVO2 (D). A high to very high correlation is shown between a single bout and three averaged exercise bouts for all VO2 kinetics parameters (p<0.001). A linear regression model (D) to convert τVO2 estimated from a single exercise bout to that obtained from the average of three exercise bouts is as follows: τVO2 for three averaged bouts = 0.887 × τVO2 for a single bout + 7.618 (R2=0.857, p<0.001). τVO2, time constant of oxygen uptake kinetics; VO2, oxygen uptake.
Differences between a single bout and three averaged exercise bouts for VO2 kinetics parameters and the 95% CI for τVO2
There were no significant differences in the baseline VO2 value, the amplitude of the increase in VO2, and time delay between a single bout and three averaged exercise bouts (p>0.05). However, τVO2 estimated from a single exercise bout was significantly smaller than that obtained from the average of three exercise bouts (mean difference=-3.7; 95% CI, -6.2 to -1.2; p=0.006). By contrast, the 95% CI for τVO2 for a single exercise bout was significantly greater than that for three averaged exercise bouts (mean difference=2.0; 95% CI, 1.1–2.8; p<0.001) (Table 2).
Comparisons in VO2 kinetics parameters and the 95% CI for τVO2 between the first, second, and third trials of the three exercise bouts
There were no significant differences in the baseline VO2 value (Fig. 4A), the amplitude of the increase in VO2 (Fig. 4B), the time delay (Fig. 4C), and the 95% CI for τVO2 (Fig. 4E) among the trials (p>0.05). However, τVO2 estimated from the first trial was significantly smaller than that obtained from the third trial of the three exercise repetitions (mean difference=-9.7; 95% CI, -17.0 to -2.4; p=0.008) (Fig. 4D).
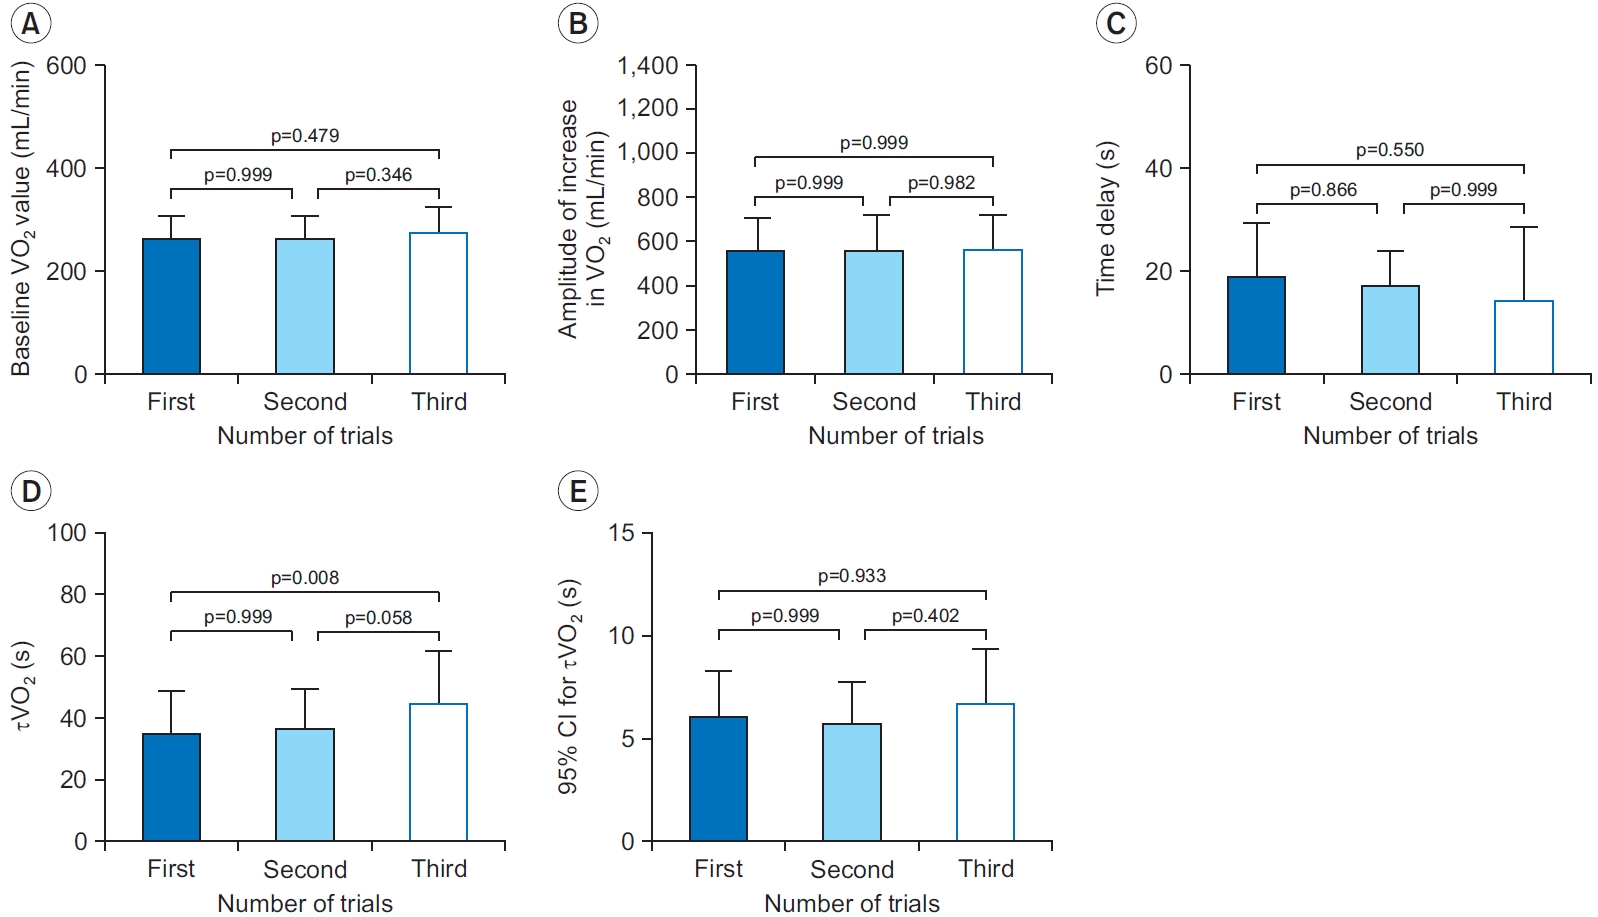
Comparisons of the baseline VO2 value (A), the amplitude of increase in VO2 (B), the time delay (C), τVO2 (D), and 95% CI for τVO2 (E). τVO2 estimated from the first trial is significantly smaller than that obtained from the third trial (p=0.008). CI, confidence interval; τVO2, time constant of oxygen uptake kinetics; VO2, oxygen uptake.
DISCUSSION
To the best of our knowledge, this is the first study to investigate the relationships between VO2 kinetics parameters estimated from a single bout and those obtained from the average of multiple exercise bouts in individuals with stroke. We found a very strong relationship between τVO2 estimated from a single exercise bout and that obtained from the average of three exercise bouts in individuals with stroke. Although there were no significant differences in the baseline VO2 value, the amplitude of increase in VO2, and time delay between a single bout and three averaged exercise bouts, the τVO2 for a single exercise bout was underestimated compared to that obtained by averaging three exercise bouts. In line with previous studies [14,15], the 95% CI for τVO2 decreased by increasing the number of averaged exercise bouts from one to three. Nevertheless, increasing the number of exercise repetitions corresponds to an increase in the burden on participants. Therefore, τVO2 estimated from a single exercise bout may be a useful parameter in the assessment of VO2 kinetics during exercise onset in individuals who are unable to perform multiple bouts of exercise. Our findings might help clinicians working in stroke rehabilitation to determine the number of exercise bouts for estimating τVO2 of their patients.
The mean τVO2 obtained from the average of three exercise bouts was similar to the data of previous studies in individuals with stroke [9,17]. Although the noise around the mean VO2 response from a single exercise bout was larger than that from three bouts averaged, the results of the correlation analyses suggest that τVO2 for a single exercise bout can reflect the relative difference in τVO2 for three averaged exercise bouts. The mean difference between τVO2 estimated from a single exercise bout and that obtained from three exercise bouts averaged was -3.7 seconds. Tomczak et al. [9] found that the τVO2 was significantly greater in patients with stroke than in age-, sex-, and activity-matched healthy adults with a mean difference of approximately 10 seconds. In addition, Murakami et al. [17] reported that the mean change in τVO2 from baseline to the end of the 8-week program of exercise was 6.2 seconds in people with stroke. Benson et al. [15] proposed that a minimally important difference for a significant change in τVO2 during interventional and comparative studies is 5 seconds. Thus, although the mean difference in τVO2 between a single and three averaged exercise bouts observed in this study was smaller than the minimally important difference for τVO2, we note that τVO2 from a single exercise bout may be underestimated compared to that obtained by averaging three exercise bouts in individuals with stroke. The linear regression model obtained in this study may allow the conversion of τVO2 estimated from a single exercise bout to that obtained from the average of three exercise bouts. Further studies with a larger sample size are warranted to confirm the robustness of the linear regression equation.
A smaller τVO2 for a single exercise bout than that for three averaged exercise bouts may be attributed to a smaller τVO2 estimated from the first trial than that obtained from the third trial of the three exercise repetitions, because the baseline VO2 value, the amplitude of the increase in VO2, the time delay, and the 95% CI for τVO2 were not significantly different among the exercise trials. No studies have reported an increase in τVO2 during exercise repetitions in healthy adults. Thus, the results of the present study may be specific to individuals with stroke. However, our data could not reveal the reason for the statistically significant difference between τVO2 for the first and third trials. Various physiological mechanisms, such as cardiovascular function, oxygen utilization by skeletal muscles, and autonomic nervous system, potentially affect the increase in VO2 during exercise onset [5,11,31]. The assessment of these mechanisms may help to elucidate the reason for the increase in τVO2 during exercise repetitions observed in this study.
This study has several limitations. First, our participants were recruited from a subacute rehabilitation ward, which may limit the ability to generalize the results to people with acute and chronic stroke. Second, this study had no control group. The difference in τVO2 among different numbers of averaged exercise bouts has been reported only in healthy young adults [13,15,16]. Therefore, further research including both individuals with stroke and age-matched healthy controls is needed to ascertain whether the findings of this study are specific to individuals with stroke. Third, this study did not compare the test-retest reliability of τVO2 with and without multiple-trial averaging; further studies investigating this point are necessary. Finally, only the mode of cycling was selected for VO2 kinetic assessment, as previous studies assessing VO2 kinetics in individuals with stroke used a cycle ergometer [9,10,12,17]. However, a treadmill, total-body recumbent stepper, robotics-assisted tilt table, or arm crank ergometer has been used for exercise testing in individuals with stroke [21,26,32]. Hence, the generalization of our findings to other modes of exercise should be made with caution.
In conclusion, the results of the correlation analysis suggest that τVO2 for a single exercise bout could reflect the relative difference in τVO2 for three averaged exercise bouts in individuals with stroke. Therefore, a single exercise bout may be desirable for assessing VO2 kinetics in individuals who have difficulty in completing multiple bouts of exercise. However, clinicians should note that τVO2 estimated from a single exercise bout might be underestimated compared to τVO2 obtained by averaging three exercise bouts in determining the number of exercise bouts for estimating τVO2 in their patients with stroke.
Notes
No potential conflict of interest relevant to this article was reported.
Conceptualization: Oyake K, Otaka Y, Momose K. Methodology: all authors. Formal analysis: Oyake K, Otaka Y, Momose K. Funding acquisition: Oyake K. Project administration: Oyake K, Baba Y, Momose K. Visualization: Oyake K, Otaka Y, Momose K. Writing–original draft: Oyake K. Writing–review and editing: Oyake K, Otaka Y, Momose K. Approval of final manuscript: all authors.
Acknowledgements
This work was supported by a grant from the Funds for a Grant-in-Aid for Young Scientists to Kazuaki Oyake (No. 18K17730). The funding source had no role in the study design; in the collection, analysis, and interpretation of the data; in writing the report; and in the decision to submit the article for publication.