Respiratory Muscle Strength in Patients With Chronic Obstructive Pulmonary Disease
Article information

Abstract
Objective
To compare the respiratory muscle strength between patients with stable and acutely exacerbated (AE) chronic obstructive pulmonary disease (COPD) at various stages.
Methods
A retrospective medical record review was conducted on patients with COPD from March 2014 to May 2016. Patients were subdivided into COPD stages 1–4 according to the Global Initiative for Chronic Obstructive Lung Disease guidelines: mild, moderate, severe, and very severe. A rehabilitation physician reviewed their medical records and initial assessment, including spirometry, maximum inspiratory pressure (MIP), maximum expiratory pressure (MEP), COPD Assessment Test, and modified Medical Research Council scale. We then compared the initial parameters in patients with a stable condition and those at AE status.
Results
The AE group (n=94) had significantly lower MIP (AE, 55.93±20.57; stable, 67.88±24.96; p=0.006) and MIP% (AE, 82.82±27.92; stable, 96.64±30.46; p=0.015) than the stable patient group (n=36). MIP, but not MEP, was proportional to disease severity in patients with AE and stable COPD.
Conclusion
The strength of the inspiratory muscles may better reflect severity of disease when compared to that of expiratory muscles.
INTRODUCTION
Chronic obstructive pulmonary disease (COPD) is one of the most common chronic lung diseases, characterized by airway limitation or obstruction. It is a progressive and partially reversible respiratory disorder which shows a particular chronic inflammatory response caused by toxins or gas inhalation [123]. One of the most characteristic symptoms of COPD is dyspnea and many factors are known to be involved in its mechanism, including airflow limitation, gas trapping, gas exchange abnormalities, mucus hypersecretion, respiratory muscle dysfunction, and skeletal muscle dysfunction [456]. Among these, skeletal muscle dysfunction is characterized by reduced muscle mass, reduced strength and endurance, atrophy of type I and IIa muscle fibers, and decreased oxidative enzyme capacity [78]. In terms of skeletal muscle dysfunctions, the quadriceps muscle has been primarily studied. Patients with COPD demonstrated increased ventilatory stress even with the same amount of exercise due to the accumulation of carbon dioxide and increases in lactic acid [910]. Respiratory muscles are also skeletal muscles, and respiratory muscle dysfunction in patients with COPD may be caused by hyperinflation of the lung or diaphragm flattening and shortening. As a result of respiratory muscle dysfunction, reduced inspiratory muscle strength and endurance increased the risk of hypercapnic respiratory failure, limited exercise, and acute exacerbation (AE), despite diaphragm adaptation [1112].
Pulmonary rehabilitation (PR) in patients with COPD mitigates symptoms, increases exercise capacities and enhances psychological stability, ultimately contributing to the prevention of complications caused by respiratory failure [13141516]. Most rehabilitation guidelines recommended aerobic and muscle strengthening exercises for the arms and legs as the basic PR program. Currently, inspiratory muscle training (IMT) as part of respiratory muscle rehabilitation is recommended only for patients with inspiratory muscle weakness [13]. However, some reports suggest that respiratory muscle trainings, such as IMT in patients with respiratory muscle weakness, might improve dyspnea and subsequently the patient's quality of life [171819]. IMT has been suggested for patients with inspiratory muscle weakness at the start of PR [3], but an adequate guideline has not yet been established to assess the minimal inspiratory muscle weakness level that requires IMT. In addition, specific data regarding the severity of inspiratory muscles in patients with COPD is lacking. To the best of our knowledge, a prior study classified maximum inspiratory pressure (MIP) and maximum expiratory pressure (MEP) according to COPD stage (mild, moderate, and severe) to show declines in MIP and MEP, and according to COPD severity in comparison with those in the control group [20]. As of yet, MIP% and MEP%, as well as comparisons of severity-specific respiratory muscle strength between patients with stable and AE COPD have not been reported.
The present study aims to determine whether respiratory muscle strength (including inspiratory and expiratory muscles) decreases according to COPD stage, and whether such differences in respiratory muscle strength vary between patients with a stable condition and those at AE status.
MATERIALS AND METHODS
Subjects
A retrospective medical record review was conducted on patients with COPD from March 2014 to May 2016. The inclusion criteria were patients diagnosed with COPD with a forced expiratory volume in 1 second (FEV1)/forced vital capacity (FVC) of less than 70% in spirometry evaluation. The patients were consulted as inpatients or registered as outpatients at the Pulmonary Rehabilitation Center of Chonbuk National University Hospital, between March 2014 and May 2016. The severity of COPD was classified based on FEV1 predictions as follows: stage I (FEV1≥80%), stage II (50%≤FEV1<80%), stage III (30%≤FEV1<50%), and stage IV (FEV1<30%), according to the Global Initiative for Chronic Obstructive Lung Disease (GOLD) standard, as suggested by the National Heart, Lung, and Blood Institute and the World Health Organization [2]. The AE group of COPD patients included those who required hospitalization for treatment with corticosteroids or antibiotics due to an acute worsening of respiratory symptoms [21]. Outcome parameters were measured within 7 days of onset of acute respiratory symptoms. The stable COPD group included outpatients with COPD who did not show deterioration of COPD.
Measurement of outcome parameters
MIP and MEP representing respiratory muscle strength were measured by using a mouth pressure meter, the MicroRPM (Micro Medical Ltd., Rochester, England) at baseline. The patients were instructed to inspire or expire through the mouthpiece. The data was recorded when the pressure was maintained for at least 1 second at the peak level, and the highest pressure among three trials was selected as the final. We calculated predicted MEP (MEP pred) and predicted MIP (MIP pred) based on the patients' ages, heights and weights. Then, relative MEP and MIP were presented as MEP% and MIP% [22]. According to recommendations of the American Thoracic Society and the European Respiratory Society, we measured FVC, FEV1, and the ratio of FEV1 to FVC (FEV1/FVC) [23]. Then, we calculated predicted values for FEV1 using the Morris formula and calculated the FEV1% [24]. We also performed the COPD Assessment Test (CAT) to examine the effects of COPD on the patient's daily lives [25]. Furthermore, we used the modified Medical Research Council (mMRC) scale to rate the severity of dyspnea from 0–4 [26].
Statistical analyses
Statistical analyses were performed by the SPSS ver. 18.0 program (SPSS Inc., Chicago, IL, USA). The Mann-Whitney U-test was used to compare the stages, mMRC scores and CAT scores, and the Student t-test was used to compare the MIPs and MEPs between the two patient groups. In addition, one-way analysis of variance was used to compare COPD stage-specific MIP and MEP, and the Kruskal-Wallis test was used to compare CAT and mMRC scores. All statistical data was considered significant at p<0.05.
RESULTS
General characteristics of the subjects
Among 130 patients with COPD, 94 were classified into the AE COPD patient group and 36 into the stable COPD patient group. A total of 102 patients were men and 28 patients were women, with a mean age of 71.34 years. According to GOLD guideline, 4 patients were classified as mild, 51 as moderate, 58 as severe, and 17 patients as at a very severe stage (Table 1).
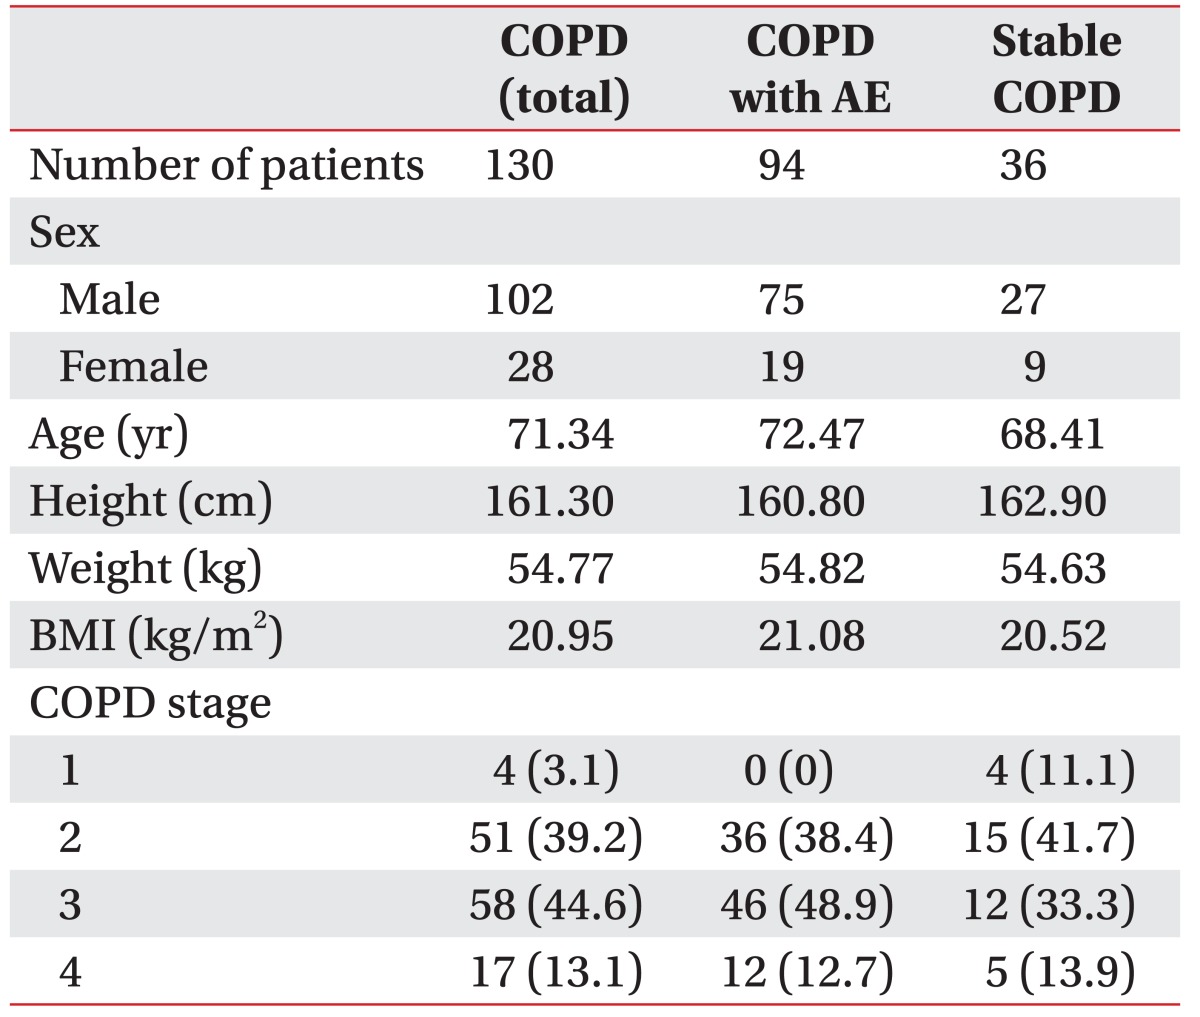
General characteristics of the patient with COPD
Respiratory functions of the AE and stable patient groups
No significant difference in COPD severity was found between the AE COPD patient group (2.74±0.67) and stable COPD patient group (2.50±0.87). However, the AE patient group had significantly lower MIP, MIP%, FEV1, and FEV1%, and significantly higher mMRC scale scores (Table 2).

Comparisons of respiratory parameters in patients with stable and acute exacerbation of COPD at baseline
The FEV1, FEV1% and FEV1/FVC decreased while the mMRC and CAT score increased with increasing stage level in the AE patient group (Table 3). When we divided the patients into a mild-to-moderate group (stage 1 or 2) or a severe-to-very severe group (stage 3 or 4), the comparison showed similar results as presented in Table 3. MIP and MIP% decreased significantly, and mMRC and CAT increased significantly with increasing stage level. However, MEP and MEP% did not significantly vary in accordance with COPD severity (Table 4).
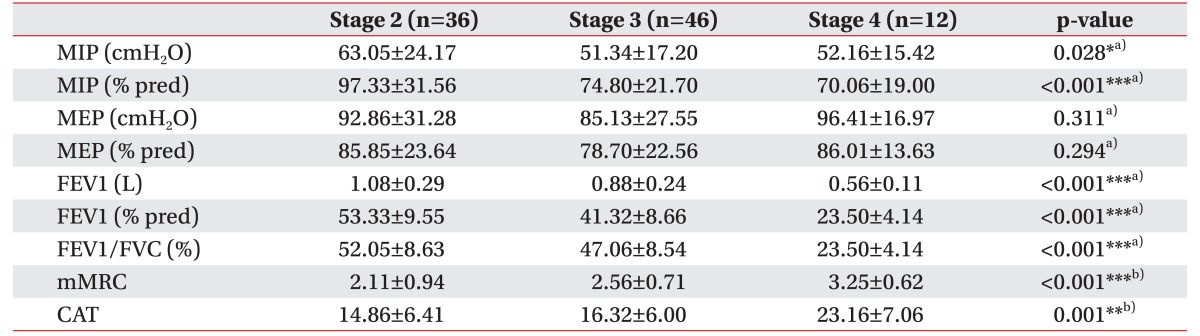
Comparisons of parameters in AE COPD group according to different stages (n=94)
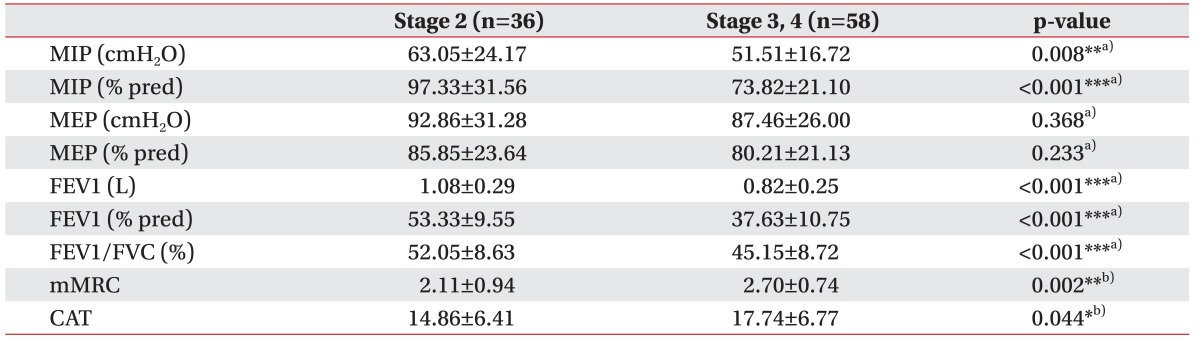
Comparisons of parameters in AE COPD group dividing into either a mild to moderate or a severe to very severe group (n=94)
In the stable COPD group, MIP and MIP% decreased in accordance with COPD stage. Both parameters showed a decreasing trend, but the differences between each stage were not statistically significant, except between stages 2 and 3 (Table 5). However, as the numbers of samples for stages 1 and 4 groups were too small, we divided the patients into either a mild-to-moderate (stage 1 or 2) or a severe-to-very severe group (stage 3 or 4) and found that MIP and MIP% were significantly lower in the stage 3 or 4 group (Table 6). In contrast, MEP% did not show a significant decline according to disease severity, as was the case in the previous analysis. mMRC and CAT scores were surprisingly lower in stage 4 than in stage 3, indicating that symptom indexes are not positively correlated with disease severity in stable patients with COPD (Table 5). However, when patients were divided into either a mild-to-moderate group (stage 1 or 2), or a severe-to-very severe group (stage 3 or 4), the mMRC and CAT scores showed an increasing trend with increasing disease severity (Table 6).
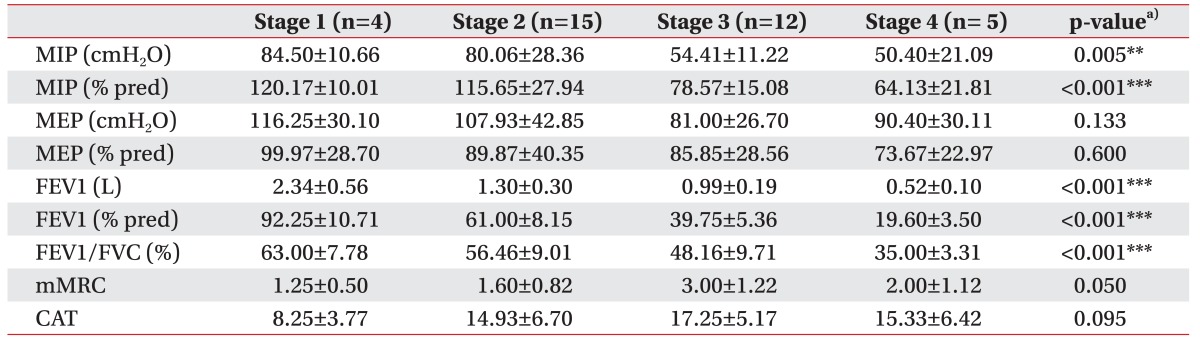
Comparisons of parameters in stable COPD group according to different stage (n=36)

Comparisons of parameters in stable COPD group dividing into either a mild to moderate or a severe to very severe group (n=36)
DISCUSSION
Although various studies have investigated respiratory muscle strength assessment and PR for patients with COPD, none of them compared the MIP and MEP in accordance with disease severity between the AE and stable patient groups. The present study classified patients with COPD into AE and stable patient groups to compare their respiratory muscle strength and examine changes in respiratory muscle strength, in accordance with COPD stage level. The results showed that MIP was significantly lower in the AE group than the stable group even though they had similar severity of disease (Table 2). Furthermore, MIP was associated with COPD severity in both groups (Tables 4, 6). However, no significant reduction in MEP was observed in accordance with COPD severity.
Whereas MIP is known to be impaired by hyperinflation due to shortening of the inspiratory muscles, MEP is considered to be less influenced by respiratory mechanics. Reduction in MEP can be attributed to muscle weakness, which is common in advanced COPD [27]. Increasing airway resistance and end-expiratory lung volume during AE COPD status could exaggerate hyperinflation due to shortening of the inspiratory muscles. MIP is thus believed to be lower in patients with AE COPD, even in those with similar disease severity (Table 2).
MIP% decreased in accordance with COPD stage in both the AE and stable COPD groups, a trend which was more clearly visible when the patients were divided into ‘mild-to-moderate’ and ‘severe-to-very severe’ COPD groups. The diaphragm is an inspiratory muscle that has an important function in MIP, and patients with COPD exhibit shortening and flattening of the diaphragm due to loss of elastic recoil in lung tissue [2829]. Furthermore, patients with COPD have been reported to exhibit reduced inspiratory muscle function due to geometric changes of the thorax, including decreased external intercostal muscle strength [2030]. Similarly, MIP was reduced in accordance with COPD severity in this study. Patients with stage 1 stable COPD showed a MIP% of 120.17±10.01, which was higher than the predicted value of MIP, and believed to be due to hyperinflation of the diaphragm in early inspiration as a result of resistive exercise.
In contrast, MEP% tended to be lower in the ‘severe-tovery severe’ COPD group than in the ‘mild-to-moderate’ COPD group, but no clear reduction was correlated with increasing disease stage. Expiratory muscles, including the abdominal and internal intercostal muscles, increase expiratory flow by increasing intrathoracic pressure and decreasing lung volume. However, for patients with COPD, expiratory muscles are known to show heightened activity in order to increase expiratory flow when an expiratory resistance, such as a bronchospasm, is present [3132]. Therefore, if expiratory resistance is present in patients with COPD, the expiratory muscles are further activated, which may result in MEP not decreasing with increasing COPD severity. Furthermore, Rochester and Braun [27] reported that MEP is less influenced by respiratory mechanics than MIP in patients with COPD. Another study also reported that MIP and expiratory muscle endurance must be assessed in order to examine the association between COPD and expiratory muscle endurance, due to such properties of expiratory muscles in patients with COPD [33].
The first limitation of this study is that the small number of patients with stable COPD hindered us from directly comparing them to patients with AE COPD. Future studies should examine a larger pool of patients with stable COPD to address this limitation.
Second, CAT scores showed an increasing trend in accordance with increasing severity in both AE and stable groups, but no difference in CAT scores was found between the two groups. However, a previous report showed that CAT scores of patients with AE COPD were approximately 5 points higher than those of patients with stable COPD [23]. One of the causes may be that the investigators who measured CAT scores were different for the patients with AE than those with stable COPD.
Third, this study calculated MEP% and MIP% by using the MIP and MEP prediction values that Wilson et al. [22] computed based on data from Caucasians. Thus, there may be a racial difference in predicted values of MIP% and MEP%. Future studies should examine Koreans to determine the normal predicted MIP and MEP values based on their ages, heights, and weights.
Although MIP reflects the disease severity of COPD better than MEP, no studies have been conducted to determine a cutoff value for MIP that requires IMT. Therefore, future studies should identify a cutoff MIP value that requires IMT during a PR program.
In conclusion, the findings of this study suggest that MIP better reflects the disease severity of COPD than MEP, and MIP measured during the stable phase of COPD more accurately reflects inspiratory muscle strength than when measured during the AE phase. Furthermore, clinicians should reference the MIP of patients with COPD prior to the beginning of a PR program and use MIP as a parameter for treatment.
ACKNOWLEDGMENTS
This paper was supported by Fund of Biomedical Research Institute, Chonbuk National University Hospital.
Notes
CONFLICT OF INTEREST: No potential conflict of interest relevant to this article was reported.