Resting-State Metabolism of Hand Knob Area on 18F-FDG PET-CT According to Hand Function and Tractography of Corticospinal Tract After Stroke
Article information

Abstract
Objective
To correlate the resting metabolism of hand knob and hand function after stroke, diffuse tensor tractography (DTT) and 18F-fluorodeoxyglucose position emission tomography (18F-FDG PET) were used to evaluate constructible state of white matter tract and metabolic state of gray matter, respectively.
Methods
A total of 17 patients were included in the study, who had suffered a stroke with hand weakness, after a stroke. They underwent diffusion tensor analysis and FDG PET in the subacute period. The ratio of both hemisphere parameters in voxel number of fibers, fractional anisotropy (FA) and apparent diffusion coefficient obtained by corticospinal tract as constructed by DTT, and the metabolism of hand knob area on cerebral cortex obtained from 18F-FDG PET were calculated. Hand movement scale was evaluated on the day of FDG PET or tractography, and at 6 months after onset.
Results
Difference of FA in DTT between both hemispheres and hand knob metabolism in FDG PET significantly correlated with the hand movement scale at the subacute stage and 6 months after onset. However, the difference of both hemispheres in DTT and metabolism of hand knob area was not significant.
Conclusion
Resting metabolism on hand knob in FDG PET correlated with hand function after stroke.
INTRODUCTION
Predicting motor recovery after stroke is important for determining the strategy of rehabilitation and the effectiveness of the therapeutic tools provided to the survivor [1]. The lateral corticospinal tract (CST) is an essential pathway for the motor activity of the extremities, and the quantitative and qualitative evaluation of CST is helpful to assess the state of injury and motor outcome after a stroke. Diffusion tensor tractography (DTT) calculates the quantitative parameters and visualizes anatomical integrity of white matter tract. It evaluates changes of CST after stroke [2], and is helpful in predicting motor outcome after a stroke [3]. However, DTT has a limitation in clinical application as it requires multistep processing, which can distort real information [4]. Moreover, evaluation of CST is difficult if a brain injury is located close to a cortical lesion. Hence, efforts are underway to find additional tools that are effective and objective in estimating the extent of injury after a stroke.
Neuroplasticity gives rise to a variety of dynamic changes at the cerebral cortex, as the brain tries to recover from neural injury. After a stroke, functional magnetic resonance imaging (MRI) provides a read of active and dynamic metabolic changes in the cerebral cortex, associated when a subject attempts at motor performance of an extremity. For a more direct measure, 18F-fluorodeoxyglucose (18F-FDG) position emission tomography (PET) shows the resting-state cerebral metabolic rate for glucose metabolism, and helps in pinpointing the hypometabolism at a cortical lesion site after a stroke [5]. Studies have demonstrated a correlation between cortical metabolic changes and a functional motor deficit. Hence, we proposed to use the 18F-FDG PET to study cortical metabolic changes at hand knob area according to hand function, and investigate the validity of 18F-FDG PET in predicting hand motor outcome after stroke, as compared with the more commonly used DTT to predict motor outcome.
MATERIALS AND METHODS
Subjects
Seventeen patients (9 females and 8 males; mean age, 60.18±13.54 years; 5 with ischemic strokes and 12 with hemorrhagic strokes) were enrolled in this study (Table 1). All patients provided their written informed consent prior to the study. The study protocol was approved by the local ethics committee. Stroke had previously been identified by a CT scan or an MRI. Additional eligibility for patients who had motor weakness in the hemiside, required agreement to undergo 18F-FDG PET and diffusion tensor imaging. The following exclusion criteria were applied: preexisting neurologic and psychologic deficits, an existing neurologic condition, or a medical state precluding 18F-FDG PET and diffusion tensor scans.
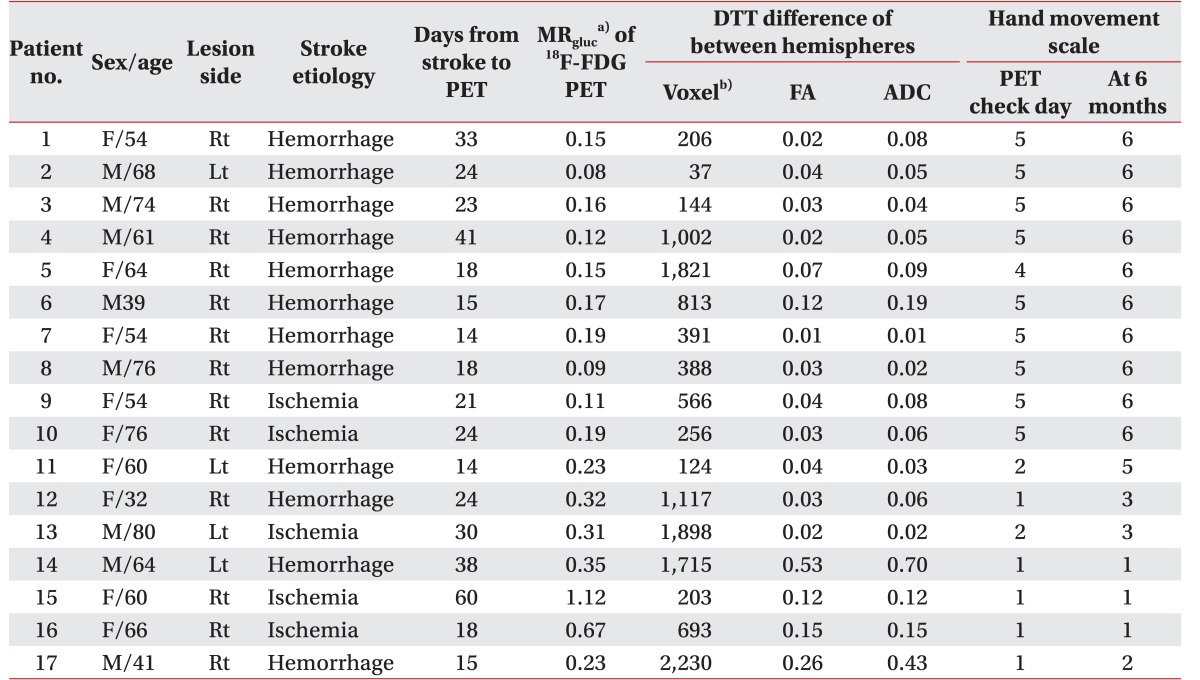
Demographic, clinical, 18F-FDG PET and DTT parameters of subjects
Scale for hand movement
A hand movement scale (HMS) was used to evaluate hand function at the subacute phase (25.3±12.1 days) and 6 months after onset of stroke. HMS is graded and classified on a scale 1 to 6, as follows: 1, no active movement in digits; 2, active flexion of all fingers in synergy only; 3, active flexion and extension of all fingers in synergy; 4, ability to extend the index finger while maintaining the other fingers in flexion; 5, ability to bring the thumb into opposition to the tip to the index finger only; and 6, ability to oppose thumb to all fingertips [6].
Diffusion tensor tractography
Diffusion tensor image was acquired using a sensitivity-encoding head coil on a 3.0T MR scanner (GE Healthcare, Waukesha, WI, USA). A diffusion-weighted echo-planar imaging sequence was performed with the following parameters, for each of the 26 noncollinear diffusion-sensitizing gradients: TR/TE/NEX, 10000 ms/95.9 ms/2.0; slice thickness, 2.6 mm; b=1000 s/mm2; matrix 128×128; FOV, 250 mm×250 mm. Eddy current-induced image distortions were removed using affine multi-scale two-dimensional registration in the Oxford Centre for Functional Magnetic Resonance Imaging of the Brain (FMRIB) Software Library (FSL; www.fmrib.ox.ac.uk/fsl). Fiber tracking was performed using DTI-Studio software (CMRM at John Hopkins Medical Institute, Baltimore, MD, USA) for reconstruction of the CST by a fraction anisotropy <0.2, and angle change >60°. Seed region of interest (ROI) was drawn in the anatomical CST portion in the anterior mid pons on the color map, and another ROI was drawn in the anatomical CST portion in the lower pons. Numbers for fiber voxel, fractional anisotropy (FA), and apparent diffusion coefficient (ADC) were calculated from CST constructed by DTT. The difference for each parameter between hemispheres was calculated as the difference between ipsilateral and contralateral hemisphere.
18F-FDG PET images
The 18F-FDG PET scan was performed with a Biograph mCT-64 PET/CT camera (Siemens Healthcare, Knoxville, TN, USA) in a quiet and dimly lit room. All subjects fasted for at least 6 hours before the scan. Image acquisition was started 30 minutes after intravenous injection of 18F-FDG (185 MBq). Brain CT was performed in the spiral mode at 120 kVp and 150 mAs. Subsequently, emission PET data were acquired for 5 minutes in the three-dimensional mode. The transaxial field of view was 25 cm, and the matrix size was 128×128. The spatial resolution in the air was 2.14 mm full width half maximum. 18F-FDG PET images were reconstructed iteratively by the ordered subset expectation maximization method.
For quantitative analyses of the 18F-FDG PET scan, image processing was performed with the SPM2 (Wellcome Trust Centre for Neuroimaging at University College London, UK) within MATLAB 2013a (MathWorks, Natick, MA, USA). Quantitative analyses were based on volumes-of-interest (VOIs). All reconstructed PET images were spatially normalized to the Montreal Neurology Institute (MNI) template space by use of a standard 18F-FDG PET template.
Using a canonical spatially-normalized T1 MRI (GE Healthcare), two VOIs of the bilateral precentral ‘hand knob’ areas were defined by us. The volume of a precentral ‘hand knob’ area was 0.7 cm3. To ensure the registration accuracy, the positions of automatically defined template VOIs were manually adjusted by VOI editing software, PMOD (PMOD Technologies Ltd, Zurich, Switzerland) [5]. The activity concentration in each VOI of the 18F-FDG PET images was calculated, with whole brain as a reference count, via the automated anatomic labeling template. The difference of regional glucose metabolic difference (MRgluc) was defined as follow: MRgluc=(contralateral hemisphere count of regional VOI/count of whole brain on 18F-FDG PET)–(ipsilateral hemisphere count of regional VOI/count of whole brain on 18F-FDG PET). The count was defined as counts per voxel in each VOI, specifically in unit of Bq/mL.
Statistical analysis
The Spearman correlation test was used to determine the relationship between DTT parameters ratio and HMS, indicating the metabolism of hand knob area on 18F-FDG PET and HMS, respectively, using the SPSS ver. 23 for Window (IBM, Armonk, NY, USA). A p-value of less than 0.05 was regarded as statistically significant. MRgluc of 18F-FDG PET and parameters ratio of DTT was used for statistical analysis. To determine the correlation between DTT and metabolism of 18F-FDG PET, the Pearson correlation test was also used. According to continuity of CST constructed by DTT, the results were classified into two groups: complete interrupted and uninterrupted group. Uninterrupted CST indicated that the CST originated from the cerebral cortex to medullar region, even though any part of CST tractography is interrupted. Mann-Whitney U-test was used to validate MRgluc according to the groups, to predict motor outcome.
RESULTS
Tractography and hand function
Statistically significant correlation was observed between FA ratio of bilateral CST and HMS, at PET check day and 6 months after onset (Table 2). However, other variants in CST tractography did not show any significant correlation compared to HMS, except ADC which showed significant correlation at 6 months after onset.
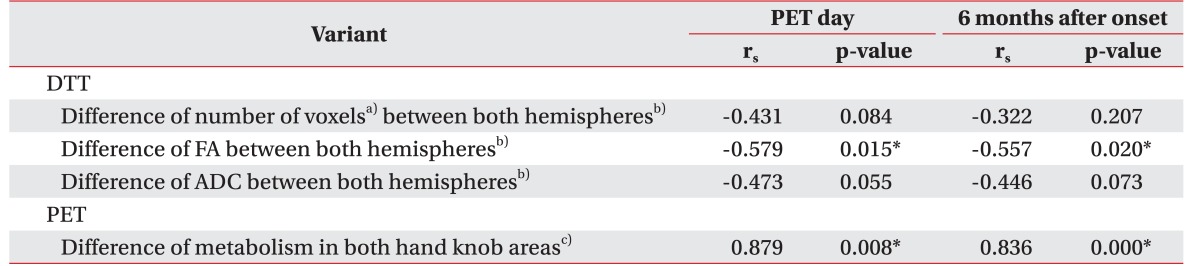
The correlation coefficient of HMS at PET-CT day and 6 months after onset, and variants of DTT and 18F-FDG PET
MRgluc in hand knob area and hand function
MRgluc in hand knob area on 18F-FDG PET showed a statistically significant correlation with HMS at the subacute stage (p<0.008) and at 6 months after onset (p=0.000) (Table 2). MRgluc in hand knob area on 18F-FDG PET showed high correlation coefficient values at PET check day and 6 months after onset (Fig. 1). However, there was no significant correlation between MRgluc and ages.

The correlation between hand knob regional glucose metabolic and hand movement scale at the subacute phase (A) and 6 months after onset (B). 18F-FDG PET, 18F-fluorodeoxyglucose position emission tomography; VOI, volume of interest. MRgluc=(contralateral hemisphere count of regional VOI/count of whole brain on 18F-FDG PET)–(ipsilateral hemisphere count of regional VOI/count of whole brain on 18F-FDG PET).
MRgluc in hand knob area and tractography
To identify the relationship between structural change of CST and metabolic change of cortical hand knob area, we evaluated the correlation between variants of CST tractography and MRgluc of 18F-FDG PET. Comparison and correlation between variants of CST tractography and MRgluc of 18F-FDG PET were not statistically significant (Table 3). Interrupted CST in DTT after stroke was seen in 5 patients. Interrupted groups and uninterrupted groups had 0.54±0.37 and 0.16±0.07 of mean difference of MRgluc, respectively. Hence, a statistically significant difference of MRgluc between interrupted and uninterrupted CST group in DTT (p<0.05) was observed. Difference of MRgluc had no correlation with the quantitative variants of CST tractography, but significant correlation was seen with regards to interrupted or uninterrupted CST tractography. Interrupted CST profoundly produced suppression of resting state metabolism on the hand knob area.

Comparison between variants of tractography and hand knob metabolism of 18F-FDG PET
DISCUSSION
The brain is a network of distributed neural components, whose interaction produces and controls motor behavior [7]. After brain injury, these functional and anatomical connectivity elicit cortical metabolic and structural changes within the ipsilateral hemisphere, and between ipsilateral and contralateral hemispheres. Functional MRI (fMRI), transmagnetic stimulation, diffusion tensor tractography, and PET have been widely performed to investigate the cortical activation changes relative to injury, and the recovery mechanism of motor function after stroke [8].
In fMRI, laterality index (LI) is used to estimate the dominance of performance for a pair of connected areas [9]. Based on this notion, we estimated the MRgluc of hand knob area in primary motor cortex to assess the resting state of metabolism on 18F-FDG PET. Precentral knob is well known as a reliable anatomical area that represents the primary motor cortex of the hand in precentral gyrus [10]. Identification of hand knob area in the axial plane has 98%–100% sensitivity and accuracy. Therefore, we calculated the resting state metabolism of hand knob at fused axial PET scan with MRI
In order to investigate changes in motor cortical activity by fMRI, it is required that the subject be able to make a typical movement, relevant to the target area in the motor cortex. However, 18F-FDG PET can detect information of resting state metabolism even derived from patients unable to perform a given task, such as after a stroke. Hence, we estimated the cortical resting hand knob metabolism on 18F-FDG PET to predict motor outcome post-stroke at the subacute stage, even for subjects who were unable to perform hand movements.
In a study such as ours, reference tissue assignment is important for quantitative assessment of the glucose metabolism, since variability of the activity concentration in the reference tissue greatly affects the study results, leading to erroneous conclusions [11]. In the current study, the whole brain was used as a reference region for quantitative analysis of 18F-FDG PET, and the MRgluc could be calculated in a consistent manner. Although patients with stroke had multiple regions of decreased glucose metabolism in the cortical and subcortical areas of the bilateral cerebral hemisphere as well as in the brain stem and both cerebellum regions, the normalization to the whole brain minimizes the variability of the activity concentration in the precentral ‘hand knob’ areas. Several studies with quantitative analysis using proportional scaling to the global mean have presented the diagnostic value of 18F-FDG PET in patients with varying kinds of brain disorders, such as Alzheimer disease, Parkinson disease, epilepsy and stroke [12].
DTT can visualize the continuity of CST and three-dimensional relationships between infarct territory and CST. Several studies indicate that DTT can be used to predict motor performance outcome after stroke [13]. Moreover, integrity of CST is an important factor to predict motor outcome. Cho et al. [3] reported that subjects who have interrupted CST in DTT presented poor clinical outcome compared to intact continuity CST. Based on these factors, we estimated an association between parameters of CST in DTT and MRgluc in PET. However, there were no statistically significant correlations between the quantitative parameters of CST and MRgluc. Only metabolic differences between interrupted and uninterrupted groups had statistical significance, indicating that interrupted CST profoundly influences the resting cortical metabolism. Quantitative parameters of CST were unrelated to MRgluc, but a statistically significant correlation was seen between FA ratio of bilateral CST and HMS at PET check day and 6 months after onset. These results explain that the resting metabolism of hand knob area is not quantitatively associated with CST tractography, but is associated with severe CST injury such as interrupted tractography. Hence, we propose that the resting metabolism of hand knob area is influenced not only by CST, but also functionally and anatomically connected lesions. However, the scanning day of diffusion tensor after stroke also varies from the PET check day; hence, the quantitative results of each parameters will change according to recovery of motor function and/or injury mechanism.
This study provides supporting evidence that 18F-FDG PET can predict motor outcome after stroke while comparing CST constructed by DTT. We also show that changes of hand knob metabolism on PET can be used to predict hand motor outcome at the subacute stage post-stroke. Our study, however, has several limitations. First, our study had a relatively small pool of patients. As such, the statistical power of subgroup analysis for interrupted and uninterrupted subjects was weak. Second, our subjects were heterogeneous, with respect to either having had ischemic or hemorrhagic stroke. Hence, there is a possibility of each stroke type having differences in cortical metabolism, which were not addressed in this study. Third, we did not evaluate 18F-FDG PET at a specific time point after stroke, resulting in the PET check day after stroke being varied from 14 to 60 days, which could possibly influence changes of resting state metabolism at hand knob area. To validate the prognostic usefulness of 18F-FDG PET with hand function after stroke, PET scanning at a fixed time after stroke is required. Even with these limitations, this study is the first to report a correlation between hand knob metabolism in 18F-FDG PET and state of CST after stroke, and the results provide a better understanding of resting state cortical metabolic changes after stroke, and improved prognosis for motor function recovery for the patient.
Notes
CONFLICT OF INTEREST: No potential conflict of interest relevant to this article was reported.