- Search
| Ann Rehabil Med > Volume 40(5); 2016 > Article |
This article has been corrected. See Ann Rehabil Med. 2016 Dec 30; 40(6): 1152.
Abstract
Objective
To determine the abnormal pulmonary function value in Korean Duchenne muscular dystrophy (DMD) patients, we performed a comparative analysis of the patients' pulmonary function value expressed as % of the overseas reference data and Korean healthy children and adolescent reference data.
Methods
We performed pulmonary function test (PFT) in a total of 27 DMD patients. We compared the patients' FVC% and FEV1% of the overseas reference data with those of the Korean children and adolescent reference data. Also, we compared the patients' MIP% and MEP% of the prediction equation data with those of the Korean children and adolescent reference data.
Results
Age of the subjects ranged from 8 to 16 years (12.03±2.27 years). The mean maximal expiratory pressure (MEP), maximal inspiratory pressure (MIP), vital capacity (VC), forced vital capacity (FVC), forced expiratory volume in 1 second (FEV1), and peak cough flow (PCF) were 36.93±9.5 cmH2O, 45.79±17.46 cmH2O, 1.4±0.43 L, 1.45±0.45 L, 1.40±0.41 L, and 206.25±61.21 L/min, respectively. The MIP%, MEP%, and FVC% of the Korean children and adolescent reference data showed statistically significant higher values than those of the prediction equation data.
Conclusion
We observed a clear numeric difference between Korean DMD patients' pulmonary function value expressed as % of the overseas data and inland data. To perform a precise assessment of respiratory function and to determine appropriate respiratory therapy, pulmonary function values of Korean DMD patients should be interpreted taking into account the inland normal pulmonary function test data.
Duchenne muscular dystrophy (DMD), an X-linked disease of the muscle caused by absence of the protein, is a neuromuscular disorder of childhood onset that is characterized by relentless deterioration of skeletal muscle function [1,2]. A continuously progressive restrictive pulmonary syndrome becomes apparent by 10 to 12 years of age and results in respiratory insufficiency during the second or third decade of life [3,4,5,6]. Unfortunately, despite advances in respiratory support, death generally occurs at 25–30 years of age, due to respiratory failure in more than 80% of cases [7].
Many studies have evaluated respiratory function in patients with DMD and have described a pattern of restrictive ventilatory impairment [4,5,6,8]. More specifically, pulmonary volumes show a characteristic pattern consisting of an initial ascending phase associated with age-related growth, followed by a plateau and finally a descending phase [5,6]. Since a correlation has been found between pulmonary volumes and DMD disease stages [4], the follow-up of respiratory function is important for predicting the prognosis. Indeed, the extent of the plateau phase and the rate of the declining phase of vital capacity (VC) correlate with the risk of respiratory failure as well as life expectancy. But spirometry does not seem to be a sensitive indicator of respiratory muscle weakness during earlier stages of the disease, because VC usually remains normal or near-normal until there is a major decline (to about 50% of predicted) in respiratory muscle strength [9].
Since skeletal muscle weakness is the main physiological consequence of dystrophin defects in DMD, expiratory muscle function has been proposed as a potential index of disease progression [10]. Maximal respiratory pressures (MRPs) are important values to be measured in a comprehensive respiratory function test, since they are indicators of respiratory muscle strength. Reference data for the maximal inspiratory pressure (MIP) and the maximal expiratory pressure (MEP) have an important role in the diagnosis and prediction of prognosis of respiratory diseases, neuromuscular weakness and health status, in general [11,12].
Just as anthropometric data are important for developing a pulmonary function test normal reference value, analysis of MRP data is also dependent on variables [13,14]. Anthropomorphic differences such as those in height and weight vary significantly between ethnic groups. In spite of the fact that normal predicted values vary from country to country, the threshold value limit from foreign standard data or empirical values have been used to assess the progression of respiratory weakness in Korean DMD patients [15]. To clearly determine the abnormal pulmonary function value in Korean DMD patients, we performed a comparative analysis of Korean DMD patients' pulmonary function value expressed as % of the overseas reference data and the Korean healthy children and adolescent reference data.
We use the previous study data for MEP, MIP, VC, forced vital capacity (FVC), forced expiratory volume in 1 second (FEV1), and peak cough flow (PCF) from the 8 to 12 years age group which included a total of 263 students from the Sin-Myeong Elementary School in Yangsan, Korea (unpublished data by Choi WH et al., 2016). We also performed additional pulmonary function tests for the 13 to 16 years age group which included a total of 80 students from the Wondong Middle School in Yangsan and Daedong Middle School in Gimhae, Korea. Assent was obtained from all students whose parent(s)/guardian(s) consented to their participation in the study.
Twenty-seven male patients with DMD (12.03±2.27 years) participated in this study. They belonged to a group of patients with neuromuscular diseases who were being followed up at the Department of Rehabilitation of Pusan National University Hospital in Busan, Korea. Inclusion criteria were as follows: (1) diagnosis of DMD confirmed clinically and by muscle biopsy (manifestation of absence of dystrophin expression, except for occasional muscle fibers, by immunohistochemistry), (2) absence of any requirement for assisted ventilation, (3) clinical stability without any symptoms or signs of inspiratory muscle insufficiency, such as orthopnea, paradoxical breathing or hypercapnia, (4) absence of major learning disabilities and ability to perform the maneuvers recommended by the American Thoracic Society/European Respiratory Society for lung volume measurements. Exclusion criteria were as follows: (1) presence of respiratory tract infection or history of acute respiratory failure requiring endotracheal ventilation and (2) use of medications that could influence respiratory function during the study period, including the use of corticosteroids.
In order to investigate the variables according to the extent of individual growth, we measured the height and body weight of the test subjects. MEP, MIP, VC, FVC, FEV1, and PCF tests were performed by two doctors in rehabilitation medicine and an experienced physiotherapist. They were trained to perform correct procedures for pulmonary function testing and to gather respiratory parameter data. Lung function data were measured using A MicroLab spirometer (CareFusion, San Diego, CA, USA), and MRPs were measured using MicroRPM (CareFusion), through a mouthpiece. In order to obtain accurate measurements, the test subjects were instructed about the use of the devices for approximately 5 minutes before the examinations. Tests were performed in a seated position, and in order to increase accuracy, they were conducted at least 3 times to obtain identical or similar values.
For the overseas reference data of MRPs, we used three prediction equations, which were designed by Wilson et al. [16], Tomalak et al. [17], and Arnall et al. [15]. Subjects in the studies by Wilson, Tomalak, Arnall and their colleagues were Caucasians, Slavs, and Americans, respectively. These equations were chosen because they had a large sample size with a similar age range and these equations used the same factor (age) as that found significant in this study and they provided separate equations for children, adults, males and females. The UK data of the MicroLab spirometer was used as the overseas reference value of FEV1 and FVC.
We expressed all values as mean±standard deviation. We used paired linear regression equations to analyze the decrease ventilatory parameters with age as well as Pearson correlation coefficient. FEV1, FVC, MEP and MIP% values of the Korean reference data were compared to values of the equation-based data obtained by Wilson, Tomalak, Arnall and their colleagues using Student t-test. The level of significance was set at p<0.05.
A total of 211 healthy male children and adolescents were selected to undergo pulmonary function test to calculate the normal reference data. The mean values across all age groups for age, height, weight, VC, FEV1, FVC, PCF, MIP, and MEP were 11.65±2.14 years, 151.76±5.50 cm, 47.08±5.00 kg, 2.63±0.33 L, 2.22±0.11 L, 2.32±0.12 L, 318.51±20.00 L/min, 58.44±10.00 cmH2O, and 52.94±6.00 cmH2O, respectively. Changes have been presented in Table 1. In general, the mean MIP tended to be higher than MEP, but not in all age groups. VC, FEV1, FVC, PCF, and MIP values were increased significantly according to age, except MEP (Table 1).
A total of 27 male DMD patients were included. Values for height, weight, PCF, VC, VC%, FVC, FVC%, FEV1, FEV1%, MIP, MEP, MIP%, and MEP% as per the age are listed in Table 2. Age ranged from 8 to 16 years (12.03±2.27 years). The mean values for height, weight, VC, FVC, FEV1, PCF, MEP, and MIP were 141.15±12.96 cm, 41.03±10.11 kg, 1.40±0.43 L, 1.45±0.45 L, 1.40±0.41 L, 206.25±61.21 L/min, 36.93±9.56 cmH2O, and 45.79±17.46 cmH2O, respectively. For analyzing the agreement between this study reference data and the previous inland reference report [18], we compared the absolute value of FEV1 and FVC in the present study data with that in the calculated data of the prediction equation obtained by Yoon et al. [18]. Fig. 1 presents the Bland-Altman graph, which shows that 95% of the differences were within two standard deviations from the mean, pointing to the fact the present study data and the calculated data are very similar.
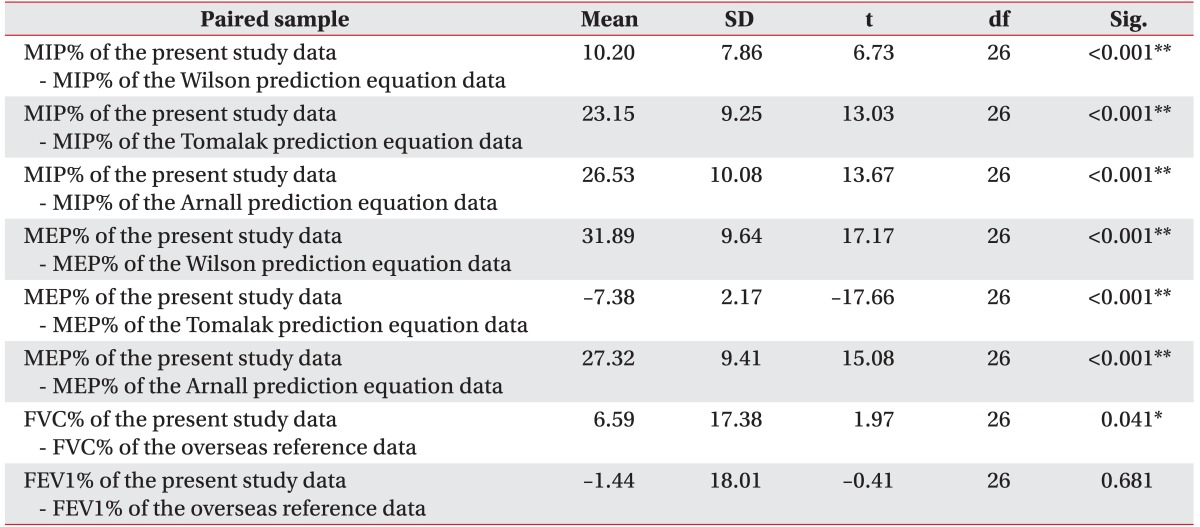
VC, FVC, and FEV1 showed peak values in the 12 to 13 years age group, but VC%, FVC%, and FEV1% showed peak values in the 9 to 10 years age group. VC, FEV1, and FVC revealed an ascending, a plateau, and a descending phase. No linear relationships were found between pulmonary volumes and ages. However, after attainment of the plateau phase, VC and VC% of the inland reference data, FEV1 and FEV1% of the inland reference data, FEV1% of the overseas reference data, FVC and FVC% of the inland reference data, and FVC% of the overseas reference data decreased at a linear rate of 0.24 L and 8.38%, 0.23 L and 4.31%, 4.42%, 0.24 L, and 11.88%, and 9.12% per year, respectively (Table 3). On comparison of the inland and overseas values, MIP%, MEP%, and FVC% of the Korean children and adolescent reference data showed statistically significantly higher values than those of the prediction equation data (p<0.001). FEV1% of the overseas data showed a slightly higher value than that of the inland data, but the difference was not statistically significant (Fig. 2A, Table 4).
In all age groups, the mean values of MIP and MIP% of the Wilson prediction equation, MIP% of the Tomalak prediction equation and MIP% of the Arnall prediction equation, and MIP% of the Korean reference data were 45.79±17.46 cmH2O and 66.59%±22.67%, 51.76%±19.16% and 48.38%±17.8%, and 80.97%±30.19%, respectively. The mean values of MEP and MEP% of the Wilson prediction equation, MEP% of the Tomalak prediction equation, MEP% of the Arnall prediction equation and MEP% of the Korean reference data were 36.93±9.56 cmH2O and 37.03%±10.71%, 44.04%±12.90%, 41.24%±12.43% and 69.58%±18.31%, respectively. MIP showed an ascending, a plateau, and a descending phase according to age. The peak age of MIP% of the Korean reference data (11.3 years) was lower than that of the Wilson prediction equation data (11.9 years) but it was higher than that of the Tomalak (10.5 years), and Arnall prediction equation data (10.6 years). The decrease rate of MIP% of the Korean reference data (8.76% per year) was higher than that of the overseas prediction equation data (7.63%, 6.22%, and 5.83% per year) (Table 3). On comparison of the inland and overseas prediction equation data, mean values of MIP% and MEP% of the Korean children and adolescent reference data were significantly higher than those of the three overseas prediction equation data (p<0.001) (Fig. 2B, Table 4).
As observed in previous cross-sectional studies [5,6,9], we found that the absolute values of VC, FVC, and FEV1 showed a characteristic pattern with an ascending, a plateau, and then a descending phase. Analogous to the data presented by other authors [5,8,19], we found that the peak values of VC, FVC, and FEV1 expressed as % of the predicted values occurred between 12 to 13 years of age, which is 2–3 years earlier than the peak expressed in absolute terms. During this interval, although the ventilatory parameters still appeared to increase when expressed as absolute values, in reality they were already decreasing. For this reason, growth no longer compensates for the reduction in lung volume caused by the deterioration of muscular function. The peak age of FEV1 expressed as % of the present study reference data was slightly earlier than that of the overseas reference data. Therefore, we suggest that respiratory parameters should be expressed as % of the inland reference data since it better describes the relationships between growth compensation and respiratory function decline in inland patients with DMD.
After reaching their peak values, VC and total lung capacity (TLC) decreased at a linear rate with age, leading to the appearance of a progressive restrictive ventilatory pattern. We found that the mean reduction rate of VC% of the inland data (8.38% per year) was similar to the 8.5% rate of loss of VC% between ages 10 and 20 found by McDonald et al. [8]. We also observed that the reduction in FEV1 correlated with the decrease in lung volume and the decrease rate of FEV1% was lower than that generally reported in previous studies [2,3,20]. This difference could be due to greater diversity of the decline rate among our patients.
MRP is a useful marker of respiratory muscle weakness. Generally, VC in DMD patients does not show an apparent decrement until 10 years of age, and MRP begins to decline earlier during the course of the disease [8]. This suggests that MRP is more sensitive for the detection of weakness of respiratory muscles than pulmonary volumes [21]. MIP values in this population were in general agreement with those previously reported in patients with DMD [8]. But, our MEP values were about 10% higher than those found by Kang et al. [22]. Kang et al. [22] recorded MEP in patients with DMD whose mean age was 17.6±5.1 years, whereas we recorded MEP in a younger group (12.03±2.27 years).
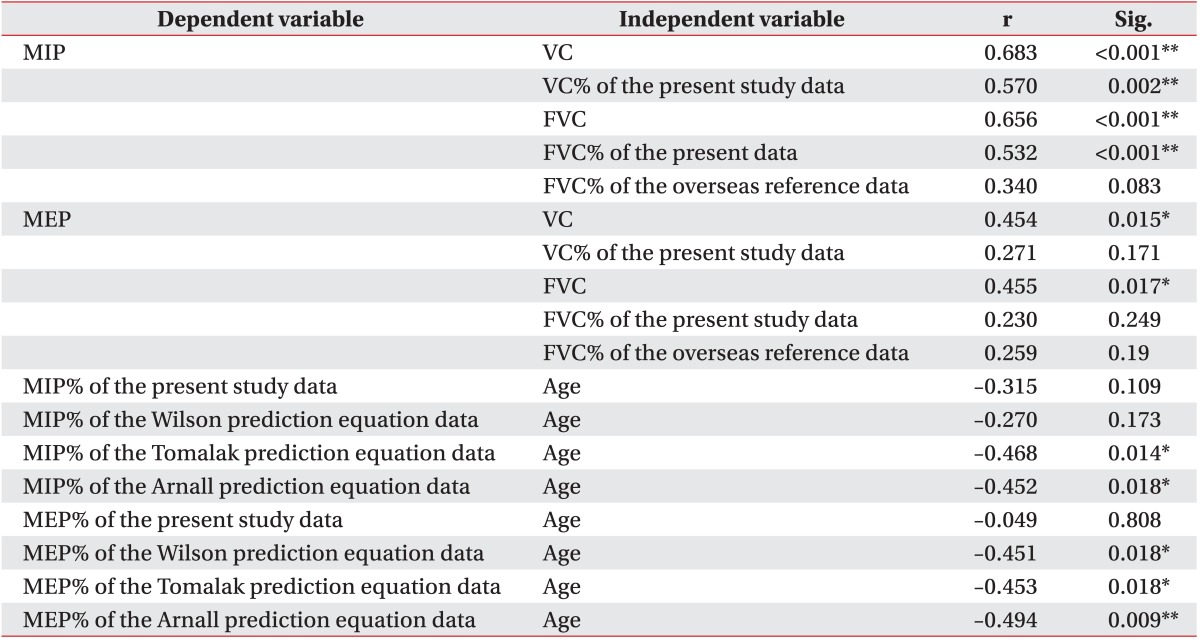
McDonald et al. [8] found earlier and more severe decreases in MEP than in MIP and in MEP and MIP than in other pulmonary function parameters in DMD. MIP and inspiratory muscle strength remained relatively well-preserved during the early stage, implying relative early sparing of the diaphragm. The significant correlation between MIP and thoracic volumes (p<0.001) (Table 5) found in this study substantiates the work of Lissoni [23] and Hahn et al. [19] who investigated 52 DMD patients and found that the decreases in lung volumes with age are caused by early dystrophic deterioration of expiratory muscles with corresponding reduction in the expiratory residual volume and increase in the residual volume and these pulmonary volume alterations occurred between ages 8 and 12 years and progressed rapidly once plateau VC was reached. They suggested that much of the decrease in intrathoracic volumes observed from age 12 to 16 years was due to expiratory muscle weakness, whereas further loss of intrathoracic volumes thereafter was more associated with decreasing inspiratory muscle strength and was observed as decreases in the inspiratory residual volume, VC, and TLC.
In this study, the absolute value of MIP was found to have increased from 8 to 12 years of age and it decreased gradually thereafter (Fig. 3A) unlike the previous study which reported that the peak value was decreased from 14 years of age [19]. Also, we found a decrease rate at 8.76% per year when MIP was expressed as % of this study reference data (Table 3), which is higher than that observed by Hahn et al. [19] (6.9% per year), but the decrease rate of MIP expressed as % of the Tomalak and Arnall prediction equation is similar to that in a previous study. Furthermore, MEP% of the present study reference data did not show a significant decrease in the age range from 8 to 16 years, whereas MEP% of the Wilson, Tomalak, and Arnall prediction equation data showed a significant correlation with age (p=0.018, p=0.018, and p=0.009) (Fig. 3B, Table 5). These results indicate that the respiratory deterioration pattern in Korean patients might be different from that in foreign patients. We suggest that inspiratory muscle weakness in Korean DMD patients might progress more rapidly than expiratory muscle weakness. Hence, intensive inspiratory muscle training such as air stacking technique (glossopharyngeal breathing) and inspiratory spirometer are needed in DMD patients in the early stage.
The aim of respiratory care for DMD patients is to ensure timely prevention and management of complications [24]. A structured, proactive approach to respiratory management that includes respiratory rehabilitative interventions has led to improvements in function, and use of assisted cough and nocturnal ventilation has been shown to prolong survival [25,26,27]. Bushby et al. [24] suggested that DMD patients with FVC <40% of the predicted value need deep lung inflation technique, and nocturnal non-invasive ventilation is indicated in patients with FVC <30% of the predicted value. In this study, FVC% of the Korean reference data tended to be higher than that of the overseas reference data in the age group of less than 13.7 years, whereas it was opposite in the age group of more than 13.7 years (Fig. 4). Two patients showed FVC <40% of the overseas reference data but FVC >40% of the present study reference data in the 8–13 years age group, and three patients showed FVC <30% of the present study reference data but FVC >30% of the overseas reference data in the 14–16 years age group. When considering the difference in the reference value of each country, pulmonary function values of Korean DMD patients could be within normal ranges compared with the domestic data in spite of abnormal values compared with the overseas data. Therefore, to perform a precise assessment of respiratory function and to determine proper respiratory therapy, pulmonary function values of Korean DMD patients should be interpreted taking into account the Korean pulmonary function values.
This study has some limitations that must be considered. In this study, we used VC, FEV1, and MRP, which are volitional and indirect methods for the assessment of respiratory muscle function. Furthermore, it is not easy to perform measurements of MRP, particularly in young patients with DMD. Finally, the number of patients in our study was relatively small, and the measurement intervals were not uniform. All of the patients were not evaluated at the same age, since in a clinical follow-up setting, it was difficult to implement the same pattern of evaluation in all DMD children.
In conclusion, interracial variability among neuromuscular disorder patients makes it difficult to analyze the result of pulmonary function test. Therefore, interpretation of the pulmonary function values has to be based on the inland data. This results in the need for providing a more optimal and proper intervention for respiratory management of patients with DMD.
ACKNOWLEDGMENTS
The authors would like to thank Pusan National University Hospital Regional Center for Respiratory Diseases for its support in this work. This work was supported by a 2-year research grant from Pusan National University Hospital in 2015.
CONFLICT OF INTEREST:
CONFLICT OF INTEREST: No potential conflict of interest relevant to this article was reported.
References
1. Walton JN, Gardner-Medwin D. Progressive muscular dystrophy and the myotonic disorders. In: Walton JN, editor. Disorders of voluntary muscle. 3rd ed. London: Churchill Livingston; 1974. p.561-613.
2. Gardner-Medwin D. Clinical features and classification of the muscular dystrophies. Br Med Bull 1980;36:109-115. PMID: 7020835.


3. Hapke EJ, Meek JC, Jacobs J. Pulmonary function in progressive muscular dystrophy. Chest 1972;61:41-47. PMID: 5049500.


4. Inkley SR, Oldenburg FC, Vignos PJ Jr. Pulmonary function in Duchenne muscular dystrophy related to stage of disease. Am J Med 1974;56:297-306. PMID: 4813648.


5. Rideau Y. Prognosis of progressive muscular dystrophy in children. Analysis of early and exact criteria. Union Med Can 1977;106:874-882. PMID: 883053.

6. Rideau Y, Jankowski LW, Grellet J. Respiratory function in the muscular dystrophies. Muscle Nerve 1981;4:155-164. PMID: 7207506.


7. Nagai T. Prognostic evaluation of congestive heart failure in patients with Duchenne muscular dystrophy: retrospective study using non-invasive cardiac function tests. Jpn Circ J 1989;53:406-415. PMID: 2769928.


8. McDonald CM, Abresch RT, Carter GT, Fowler WM Jr, Johnson ER, Kilmer DD, et al. Profiles of neuromuscular diseases. Duchenne muscular dystrophy. Am J Phys Med Rehabil 1995;74(5 Suppl): S70-S92. PMID: 7576424.


9. Black LF, Hyatt RE. Maximal respiratory pressures: normal values and relationship to age and sex. Am Rev Respir Dis 1969;99:696-702. PMID: 5772056.

10. Gayraud J, Ramonatxo M, Rivier F, Humberclaude V, Petrof B, Matecki S. Ventilatory parameters and maximal respiratory pressure changes with age in Duchenne muscular dystrophy patients. Pediatr Pulmonol 2010;45:552-559. PMID: 20503279.


11. Arora NS, Rochester DF. Respiratory muscle strength and maximal voluntary ventilation in undernourished patients. Am Rev Respir Dis 1982;126:5-8. PMID: 7091909.

12. Celli BR. Clinical and physiologic evaluation of respiratory muscle function. Clin Chest Med 1989;10:199-214. PMID: 2661118.


13. Enright PL, Kronmal RA, Manolio TA, Schenker MB, Hyatt RE. Respiratory muscle strength in the elderly: correlates and reference values. Cardiovascular Health Study Research Group. Am J Respir Crit Care Med 1994;149(2 Pt 1): 430-438. PMID: 8306041.


14. Hautmann H, Hefele S, Schotten K, Huber RM. Maximal inspiratory mouth pressures (PIMAX) in healthy subjects: what is the lower limit of normal? Respir Med 2000;94:689-693. PMID: 10926341.


15. Arnall DA, Nelson AG, Owens B, CebriaiIranzo MA, Sokell GA, Kanuho V, et al. Maximal respiratory pressure reference values for Navajo children ages 6-14. Pediatr Pulmonol 2013;48:804-808. PMID: 23661611.


16. Wilson SH, Cooke NT, Edwards RH, Spiro SG. Predicted normal values for maximal respiratory pressures in caucasian adults and children. Thorax 1984;39:535-538. PMID: 6463933.


17. Tomalak W, Pogorzelski A, Prusak J. Normal values for maximal static inspiratory and expiratory pressures in healthy children. Pediatr Pulmonol 2002;34:42-46. PMID: 12112796.


18. Yoon KA, Lim HS, Koh YY, Kim H. Normal predicted values of pulmonary function test in Korean school-aged children. J Korean Pediatr Soc 1993;36:25-37.
19. Hahn A, Bach JR, Delaubier A, Renardel-Irani A, Guillou C, Rideau Y. Clinical implications of maximal respiratory pressure determinations for individuals with Duchenne muscular dystrophy. Arch Phys Med Rehabil 1997;78:1-6. PMID: 9014949.


20. Bye PT, Ellis ER, Issa FG, Donnelly PM, Sullivan CE. Respiratory failure and sleep in neuromuscular disease. Thorax 1990;45:241-247. PMID: 2113317.


21. Griggs RC, Donohoe KM, Utell MJ, Goldblatt D, Moxley RT 3rd. Evaluation of pulmonary function in neuromuscular disease. Arch Neurol 1981;38:9-12. PMID: 7458733.


22. Kang SW, Kang YS, Sohn HS, Park JH, Moon JH. Respiratory muscle strength and cough capacity in patients with Duchenne muscular dystrophy. Yonsei Med J 2006;47:184-190. PMID: 16642546.


23. Lissoni A. Assessment of the respiratory function in individuals with Duchenne muscular dystrophy. Eura Medicophys 2001;37:71-81.
24. Bushby K, Finkel R, Birnkrant DJ, Case LE, Clemens PR, Cripe L, et al. Diagnosis and management of Duchenne muscular dystrophy. Part 2: implementation of multidisciplinary care. Lancet Neurol 2010;9:177-189. PMID: 19945914.


25. Phillips MF, Quinlivan RC, Edwards RH, Calverley PM. Changes in spirometry over time as a prognostic marker in patients with Duchenne muscular dystrophy. Am J Respir Crit Care Med 2001;164:2191-2194. PMID: 11751186.


26. Gomez-Merino E, Bach JR. Duchenne muscular dystrophy: prolongation of life by noninvasive ventilation and mechanically assisted coughing. Am J Phys Med Rehabil 2002;81:411-415. PMID: 12023596.


27. Eagle M, Baudouin SV, Chandler C, Giddings DR, Bullock R, Bushby K. Survival in Duchenne muscular dystrophy: improvements in life expectancy since 1967 and the impact of home nocturnal ventilation. Neuromuscul Disord 2002;12:926-929. PMID: 12467747.


Fig. 1
Bland-Altman plot showing individual differences between the two tests. The solid line indicates the mean difference between paired measurements and the dotted lines indicate the 95% limits of agreement. It shows that 95% of the differences were within two standard deviations from the mean, pointing to the fact that both tests are very similar in terms of FVC (A) and FEV1 (B) values. FVC, forced vital capacity; FEV1, forced expiratory volume in 1 second.
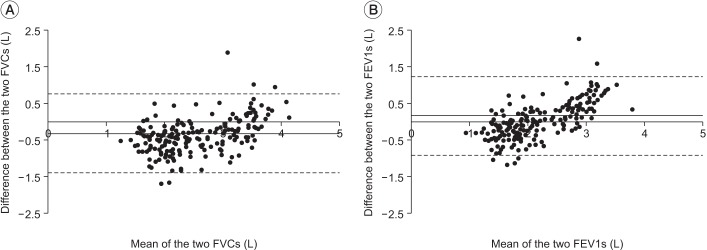
Fig. 2
Comparison of FVC and FEV1% of the Korean reference data and the overseas reference data (A). On comparison of two inland and overseas data, FVC% of the Korean children and adolescent reference data was higher than that of the overseas data and the differences were statistically significant. FEV1% of the overseas data showed a slightly higher value than that of the inland data, but the difference was not statistically significant (*p<0.05, **p<0.001). Comparison of MIP% and MEP% of the Korean reference data and the overseas reference data (B). On comparison of the inland and overseas prediction equation data, MIP% and MEP% of the Korean children and adolescent reference data were significantly higher than those of the three overseas prediction equation data (*p<0.05, **p<0.001).
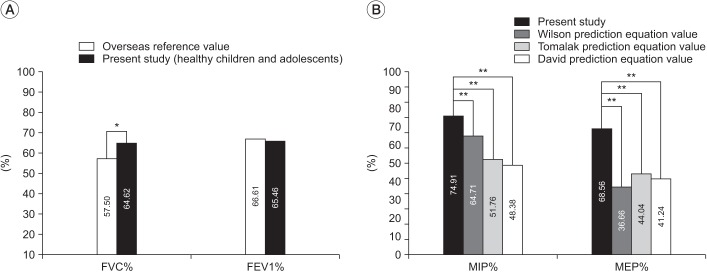
Fig. 3
Comparison of MIP (A) and MEP (B) values predicted by the reference data proposed in our study and three previous studies according to age. We found a decrease rate of 8.76% per year when MIP expressed as % of this study reference data, which is higher than that in the previous study data, but the decrease rate of MIP expressed as % of the Tomalak and Arnall prediction equation data was similar to that in a previous study. MEP% of the present study reference data did not show a significant decrease in the age range from 8 to 16 years, whereas MEP% of the Wilson, Tomalak and Arnall prediction equation data showed a significant correlation with age.
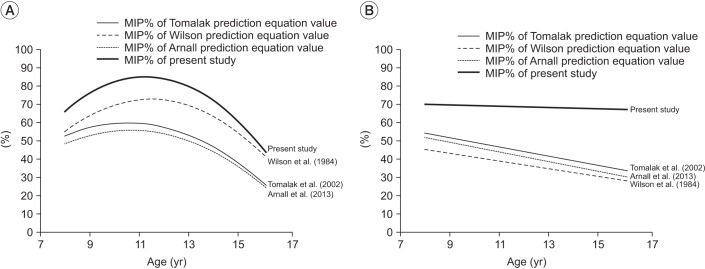
Fig. 4
Comparison of FVC expressed as % of the overseas reference data and Korean reference data according to age. FVC% of the Korean reference data tended to be higher than that of the overseas reference data in the age group of less than 13.7 years, whereas it was opposite in the age group of more than 13.7 years. FVC, forced vital capacity.
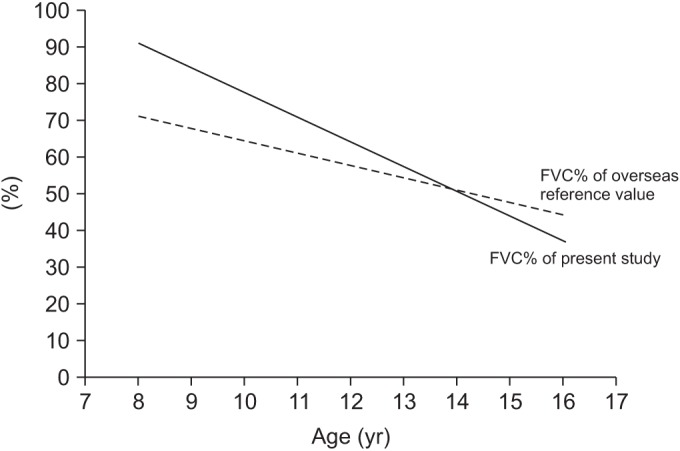
Table 2
Demographic data and mean VC, FEV1, FVC, PCF values, and MRP (maximal respiratory pressure) and MRP% of the overseas and inland data in relation to age of DMD patients
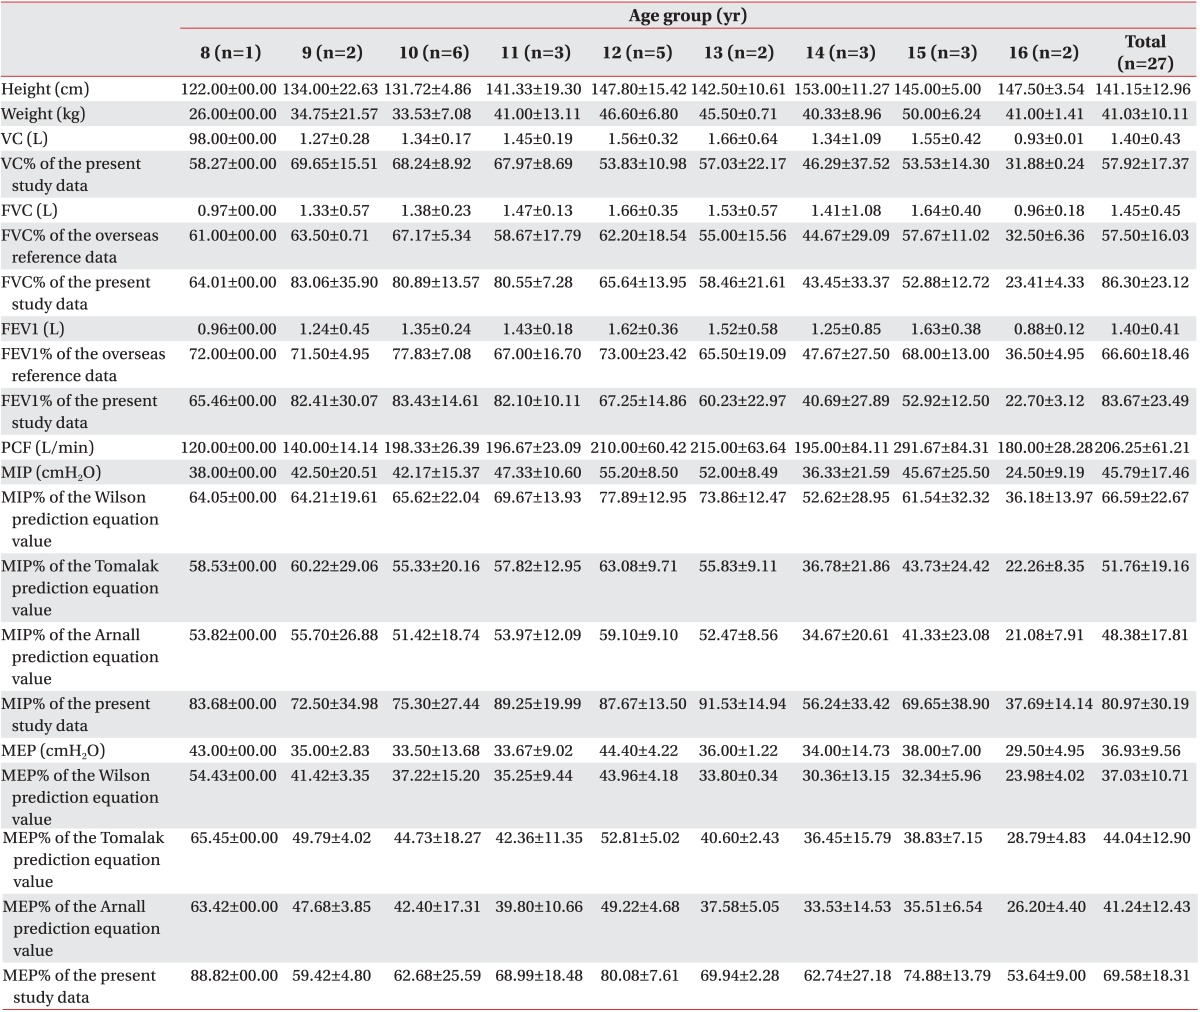
Table 3
Age at which DMD children presented a peak value of respiratory parameters and the decrease rate per year
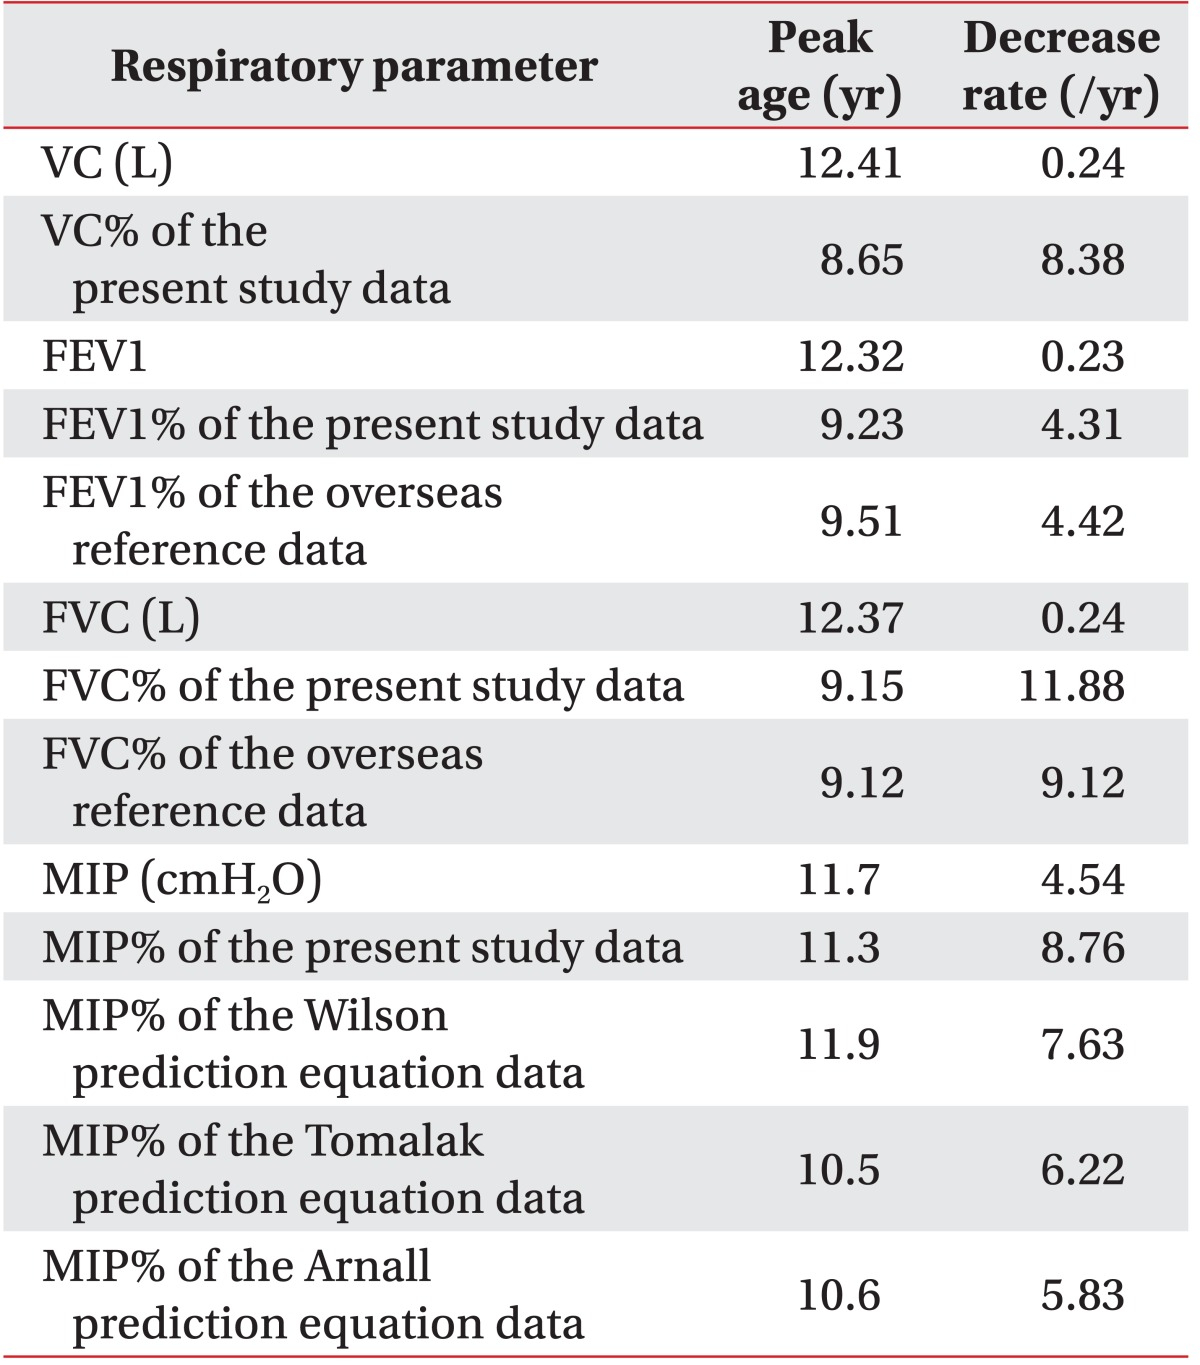
The values were expressed in liter or expressed as % of the Korean children and adolescent reference data (present study data) and the overseas prediction equation data year.
MIP, maximal inspiratory pressure; VC, vital capacity; FEV1, forced expiratory volume in 1 second; FVC, forced vital capacity.
- TOOLS
-
METRICS

-
- 2 Web of Science
- 0 Crossref
- Scopus
- 4,571 View
- 49 Download
- Related articles in ARM
-
Assessment of Hand Function in Boys with Duchenne Muscular Dystrophy1995 September;19(3)


