Department of Rehabilitation Medicine, Presbyterian Medical Center, Seonam University College of Medicine, Jeonju, Korea.
Corresponding author: Ki Pi Yu. Department of Rehabilitation Medicine, Presbyterian Medical Center, Seonam University College of Medicine, 365 Seowon-ro, Wansan-gu, Jeonju 54987, Korea. Tel: +82-63-230-1460, Fax: +82-63-285-3385, withjoy9@naver.com
• Received: August 24, 2015 • Accepted: February 1, 2016
This is an open-access article distributed under the terms of the Creative Commons Attribution Non-Commercial License (http://creativecommons.org/licenses/by-nc/4.0) which permits unrestricted noncommercial use, distribution, and reproduction in any medium, provided the original work is properly cited.
To investigate the relationship between glycosylated hemoglobin A (HbA1c) and complex regional pain syndrome (CRPS) in stroke patients with type 2 diabetes mellitus (T2DM).
Methods
A retrospective chart review was performed of stroke patients from January 2012 to December 2013. We reviewed 331 patients and included 200 in the analysis. We divided them into CRPS and non-CRPS groups and compared them by age, gender, stroke lesion, cause of stroke, duration of T2DM, HbA1c (%), National Institutes of Health Stroke Scale score, affected shoulder flexor muscle strength, Fugl-Meyer Assessment score, motricity index, Functional Independence Measure, Korean version of Modified Barthel Index, blood glucose level on admission day, duration from stroke onset to HbA1c check, and duration from stroke onset to three-phase bone scan for CRPS diagnosis. Thereafter, we classified the patients into five groups by HbA1c level (group 1, 5.0%–5.9%; group 2, 6.0%–6.9%; group 3, 7.0%–7.9%; group 4, 8.0%–8.9%; and group 5, 9.0%–9.9%) and we investigated the difference in CRPS prevalence between the two groups.
Results
Of the 200 patients, 108 were in the CRPS group and 92 were in the non-CRPS group. There were significant differences in HbA1c (p<0.05) between the two groups but no significant differences in any other factors. Across the five HbA1c groups, there were significant differences in CRPS prevalence (p<0.01); specifically, it increased as HbA1c increased.
Conclusion
This study suggests that higher HbA1c relates to higher CRPS prevalence and thus that uncontrolled blood glucose can affect CRPS occurrence in stroke patients with diabetes.
Complex regional pain syndrome (CRPS) is characterized by disproportionate pain, allodynia, vasomotor changes, decreased range of motion, hyperalgesia, edema, and skin temperature or color change [1]. In the past, it was called reflux sympathetic dystrophy in acknowledgement that it was primarily an abnormal sympathetic nervous reflex that was involved. However, both sympathetically maintained pain and sympathetically independent pain have been found to exist, and thus the name was ultimately changed to CRPS by the International Association for the Study of Pain (IASP) in 1994. CRPS is divided into type I and type II by absence or presence of peripheral nerve injury [12]; type II generally occurs more frequently, but type I occurs more frequently in stroke patients [3].
CRPS occurs in the affected limbs of stroke patients in the recovery phase. Prevalence differs widely according to diagnostic standards and methods [4] and has been reported to vary from 12.5% to 70% depending on clinical signs and symptoms [56]. CRPS onset time is known to be from 1 to 5 months after stroke, and if it is not treated properly, there is a high possibility of irreversible change [4].
The pathophysiology of CRPS is unclear, but it is usually considered a multifactorial disease with clinical features that range from abnormal reflection to tissue damage causes such as neurogenic inflammation, nociceptive sensitization, vasomotor dysfunction, and maladaptive neuroplasticity [7].
Diabetes mellitus (DM) is a multisystem disease characterized by persistent hyperglycemia that has both acute and chronic biochemical and anatomical sequelae [8]. Glycosylated hemoglobin A (HbA1c) is an index of blood glucose control, and it reflects the average blood glucose level for 2 to 3 months [910]. Normal HbA1c is below 6%, but it exceeds 6% in diabetes and can increase up to 10%–12% [11].
A number of studies have reported that CRPS is one of the musculoskeletal complications in patients with DM [81213], but there are no studies on the relationship between HbA1c and CRPS prevalence. Thus, the purpose of this study was to investigate the relationship between HbA1c and CRPS prevalence in stroke patients with diabetes and to understand how uncontrolled hyperglycemia can affect CRPS occurrence in these patients.
MATERIALS AND METHODS
Subjects
We retrospectively reviewed the medical records of 331 patients who had been admitted to Jesus Hospital (Presbyterian Medical Center) from January 2012 to December 2013. The inclusion criteria for the study were (1) stroke confirmed through either cerebral infarction or cerebral hemorrhage and (2) a diagnosis of diabetes. The following were the exclusion criteria for this study: history of injury in an upper extremity, hyperthyroidism, hyperparathyroidism, peripheral neuropathy (including from diabetes), or previous CRPS.
Methods
Diagnosis of CRPS
The patients were diagnosed using the IASP's proposed revised CRPS clinical diagnostic criteria [14] and diagnosed by a physician in the Department of Nuclear Medicine based on a three-phase bone scan (TPBS) [15]. We divided the patients into two groups, with or without CRPS, and compared them by age, gender, stroke lesion, DM duration, HbA1c (%), National Institutes of Health Stroke Scale (NIHSS) score, affected shoulder flexor muscle strength, Fugl-Meyer Assessment (FMA) score, motricity index (MI), Functional Independence Measure (FIM), Korean version of Modified Barthel Index (K-MBI) score, blood glucose level on admission day, duration from stroke onset to HbA1c check, and duration from stroke onset to the TPBS for CRPS diagnosis (Fig. 1).
HbA1c
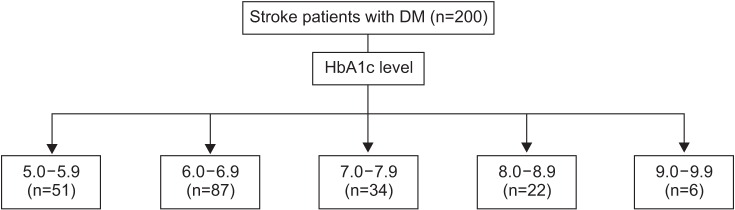
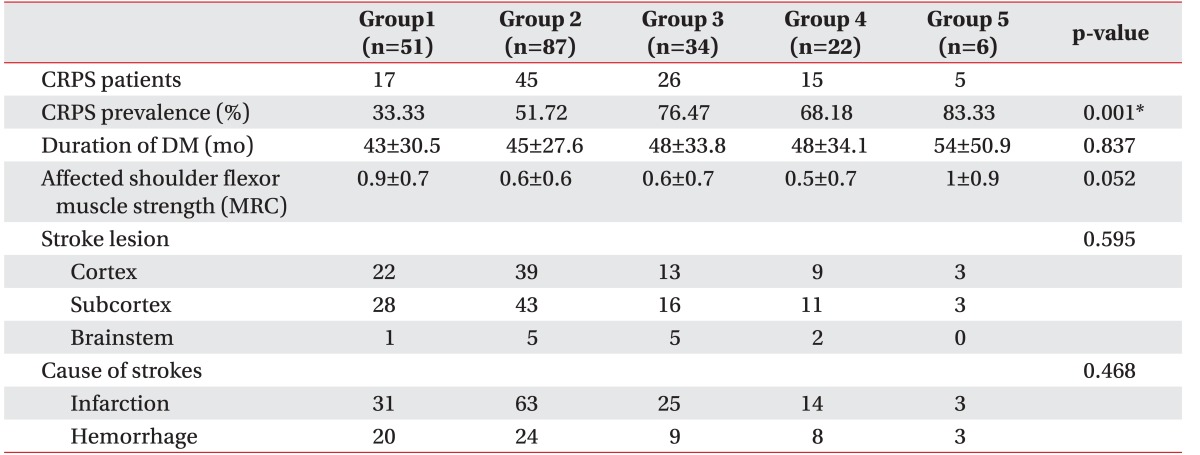
Among the 200 stroke patients with DM, we classified them into five groups by HbA1c value: group 1, 5.0%–5.9%; group 2, 6.0%–6.9%; group 3, 7.0%–7.9%; group 4, 8.0%–8.9%; and group 5, 9.0%–9.9%. Specifically, we compared the CRPS prevalence in each HbA1c group (Fig. 2).
Statistical analysis
Statistical analyses were performed using SPSS ver. 20.0 (IBM SPSS Inc., Armonk, NY, USA). We conducted independent t-tests to compare the CRPS and non-CRPS groups and chi-squared tests to compare CRPS prevalence in the five HbA1C groups. Statistical significance was set at p<0.05 for both sets of tests.
RESULTS
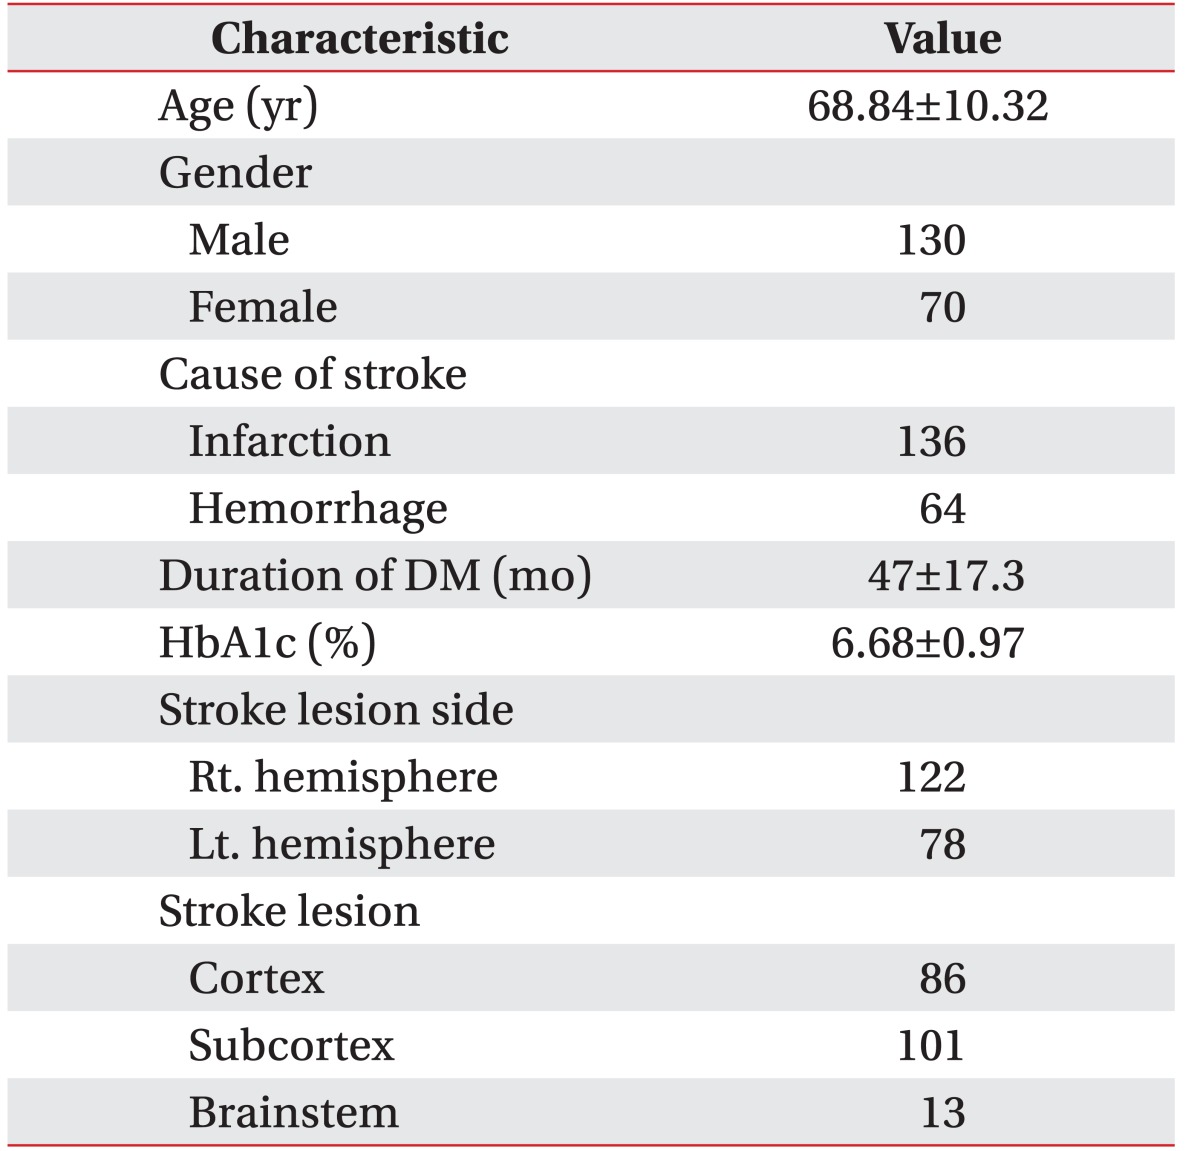
We analyzed the data from a total of 200 stroke patients with DM, 130 males and 70 females; mean patient age was 68.84±10.32 years. The patients comprised 136 with cerebral infarction and 64 with hemorrhagic stroke; mean DM duration was 47±17.3 months and mean HbA1c was 6.68±0.97% (Table 1).
One hundred eight of the 200 subjects were diagnosed with CRPS, with the remaining 92 comprising the non-CRPS group. There were significant differences in HbA1c (p<0.05) but no significant differences between the CRPS groups in age, gender, stroke lesion, cause of stroke, DM duration, NIHSS score, affected shoulder flexor muscle strength, FMA score, MI, FIM, K-MBI score, blood glucose level duration from stroke onset to HbA1c check, or duration from stroke onset to the TPBS for CRPS diagnosis (p>0.05) (Table 2).
By HbA1c level, CRPS prevalence differed significantly (p<0.01)—group 1, 33%; group 2, 51%; group 3, 76%; group 4, 68.18%; and group 5, 83.33% (Table 3); that is, as HbA1c increased, CRPS prevalence increased as well (Fig. 3).
DISCUSSION
DM is considered highly related to CRPS occurrence [81213], and thus we attempted to investigate how uncontrolled hyperglycemia can affect CRPS occurrence in stroke patients with diabetes by analyzing the relationship between HbA1c and CRPS prevalence in these patients. In this study, as HbA1c values increased, CRPS prevalence increased as well, and thus we consider that maintaining adequate blood glucose levels is important for reducing CRPS occurrence in stroke patients with diabetes.
CRPS is characterized by severe pain, allodynia, hyperalgesia, and motor and autonomic signs and symptoms [7]. With regard to the pain itself, Calder et al. [16] and Van der Laan and Goris [17] reported that inflammatory response is the primary pain mechanism in CRPS patients. In addition, the activation of skin nociceptor that we can see in these patients induces retrograde depolarization of primary afferent nerves with small diameters, increasing the secretion of neuropeptides such as substance P and calcitonin gene-related peptide (CGRP) in the sensory endings of the skin [18]. These neuropeptides evoke vasodilatation and protein extravasations in the tissue, and the resulting signs such as reddening, warming, and edema are called neurogenic inflammation [18]; most inflammatory changes from CRPS are mediated by CGRP and substance P. Serum concentrations of both of these substances are higher in CRPS patients than in healthy control individuals [1920].
The concentrations of cytokines also show differences. In skin biopsy results, the concentrations of tumor necrosis factor-alpha (TNF-α) and interleukin-6 (IL-6) were much higher in upper extremities affected by CRPS than in normal upper extremities [2122]. In early-stage CRPS (3 months on average), water-soluble TNF receptor and pro-inflammatory cytokines (TNF), IL-1, and IL-8 increased in blood serum whereas anti-inflammatory cytokines (IL-4, IL-10, and transforming growth factor-beta1 [TGF-β1]) decreased [2324]. It was reported that these pro-inflammatory cytokines caused sensitization and hyperalgesia [25], which indicates that neurological inflammatory response plays an important role in the occurrence of CRPS.
Type 2 diabetes mellitus (T2DM) is an inflammatory disorder that develops when there is a pathologic problem in the immune system [26], and it features high blood concentrations of congenital immune mediators due to the occurrence of pathologic consequences [927]. It has been reported that compared with control groups, the serum levels of pro-inflammatory cytokines (IL-1β, IL-6 and TNF-α), sialic acid and C-reactive protein, and malondialdehyde were significantly higher in T2DM patients [92627282930313233]. As glycemic control in these patients worsens (HbA1c >6.5%), serum TNF-α appears to increase proportionally [28].
These secretions of pro-inflammatory cytokines in diabetes play an important role and could be associated with neurogenic inflammation and vasomotor dysfunction in CRPS. Classically, CRPS is subdivided into three phases (acute, atrophic, and dystrophic). Among these, the primary acute inflammatory phase can last for weeks up to 6 months and is characterized by painful range of motion, edema, warmth, and erythema of the hand and wrist [34353637]. Therefore, we consider that worsening glycemic control is associated with the acute inflammatory phase of CRPS.
According to the result of this study, the higher the HbA1c in stroke patients with diabetes, the higher their CRPS prevalence. HbA1c values reflect hyperglycemia, during which pro-inflammatory cytokines and acute-phase reactive proteins increase, resulting in increased neuroinflammatory reactions and CRPS.
However, our study was limited by a number of important factors. The study was cross-sectional and thus it was limited to inferring causal relationships. Second, shoulder joint subluxation, which is known a factor in CRPS occurrence, was not included in the study; instead we substituted shoulder muscle flexor strength and motricity index, neither of which controlled for the shoulder subluxation. Finally, the number of CRPS patients was small for the comparison between CRPS prevalence and HbA1c. These limitations suggest possible directions for future study. Furthermore, long-term follow-up research on the relationship between decreased HbA1c and improved CRPS is considered necessary. Then, we can suggest physiological grounds for any causal relationships between blood glucose level and CRPS through studies about improved CRPS symptoms or reduced absorption ratio on TPBS with lower HbA1c.
In this study, we concluded that uncontrolled hyperglycemia is related to CRPS occurrence in stroke patients with DM by comparing their HbA1c values with their CRPS prevalence; because CRPS prevalence increased as HbA1c increased, we considered that uncontrolled hyperglycemia affects CRPS occurrence. Therefore, it is necessary to maintain adequate blood glucose control in stroke patients with diabetes in addition to providing range of motion exercises and medical, physical, and occupational therapy.
CONFLICT OF INTEREST:
CONFLICT OF INTEREST: No potential conflict of interest relevant to this article is reported.
REFERENCES
1. Stanton-Hicks M, Janig W, Hassenbusch S, Haddox JD, Boas R, Wilson P. Reflex sympathetic dystrophy: changing concepts and taxonomy. Pain 1995;63:127-133.
2. Merskey H, Bogduk N. Classification of chronic pain: descriptions of chronic pain syndromes and definitions of pain terms. Seattle: IASP Press; 1994.
3. Pertoldi S, Di Benedetto P. Shoulder-hand syndrome after stroke: a complex regional pain syndrome. Eura Medicophys 2005;41:283-292.
6. Daviet JC, Preux PM, Salle JY, Lebreton F, Munoz M, Dudognon P, et al. Clinical factors in the prognosis of complex regional pain syndrome type I after stroke: a prospective study. Am J Phys Med Rehabil 2002;81:34-39.
11. Graf RJ, Halter JB, Pfeifer MA, Halar E, Brozovich F, Porte D Jr. Glycemic control and nerve conduction abnormalities in non-insulin-dependent diabetic subjects. Ann Intern Med 1981;94:307-311.
20. Schinkel C, Gaertner A, Zaspel J, Zedler S, Faist E, Schuermann M. Inflammatory mediators are altered in the acute phase of posttraumatic complex regional pain syndrome. Clin J Pain 2006;22:235-239.
21. Huygen FJ, Ramdhani N, van Toorenenbergen A, Klein J, Zijlstra FJ. Mast cells are involved in inflammatory reactions during Complex Regional Pain Syndrome type 1. Immunol Lett 2004;91:147-154.
23. Uceyler N, Eberle T, Rolke R, Birklein F, Sommer C. Differential expression patterns of cytokines in complex regional pain syndrome. Pain 2007;132:195-205.
24. Wesseldijk F, Huygen FJ, Heijmans-Antonissen C, Niehof SP, Zijlstra FJ. Six years follow-up of the levels of TNF-alpha and IL-6 in patients with complex regional pain syndrome type 1. Mediators Inflamm 2008;2008:469439.
25. Parkitny L, McAuley JH, Di Pietro F, Stanton TR, O'Connell NE, Marinus J, et al. Inflammation in complex regional pain syndrome: a systematic review and meta-analysis. Neurology 2013;80:106-117.
27. Crook MA, Tutt P, Pickup JC. Elevated serum sialic acid concentration in NIDDM and its relationship to blood pressure and retinopathy. Diabetes Care 1993;16:57-60.
28. Mirza S, Hossain M, Mathews C, Martinez P, Pino P, Gay JL, et al. Type 2-diabetes is associated with elevated levels of TNF-alpha, IL-6 and adiponectin and low levels of leptin in a population of Mexican Americans: a cross-sectional study. Cytokine 2012;57:136-142.
32. Pickup JC, Chusney GD, Thomas SM, Burt D. Plasma interleukin-6, tumour necrosis factor alpha and blood cytokine production in type 2 diabetes. Life Sci 2000;67:291-300.
33. Dandona P, Aljada A, Chaudhuri A, Bandyopadhyay A. The potential influence of inflammation and insulin resistance on the pathogenesis and treatment of atherosclerosis-related complications in type 2 diabetes. J Clin Endocrinol Metab 2003;88:2422-2429.
Flow diagram of patients included in this study by CRPS versus non-CRPS groups. DM, diabetes mellitus; CRPS, complex regional pain syndrome; PPN, peripheral polyneuropathy.
Fig. 2
Flow diagram of the five HbA1c groups. DM, diabetes mellitus; HbA1c, glycosylated hemoglobin A.
Fig. 3
CRPS prevalence by HbA1c; as HbA1c increased, CRPS prevalence increased. CRPS, complex regional pain syndrome; HbA1c, glycosylated hemoglobin A.
Table 1
General characteristics of subjects (n=200)
Values are presented as mean±standard deviation or number of subjects.
DM, diabetes mellitus; HbA1c, glycosylated hemoglobin A.
Table 2
Comparisons between the CPRS and non-CRPS groups
Values are presented as mean±standard deviation or number of subjects.
DM, diabetes mellitus; HbA1c, glycosylated hemoglobin A; NIHSS, National Institutes of Health Stroke Scale; MRC, Medical Research Council; FMA, Fugl-Meyer Assessment scale; MI, motricity index; FIM, Functional Independence Measure; K-MBI, Korean version of Modified Barthel Index; TPBS, three-phase bone scan; CRPS, complex regional pain syndrome.
Statistically significant as p<0.05. a)Chi-square test, b)independent t-test.
Table 3
Correlations between CRPS prevalence, age, DM duration, affected shoulder flexor muscle strength, stroke lesion, and stroke cause by HbA1c
Values are presented as number of subjects or mean±standard deviation.
CRPS, complex regional pain syndrome; MRC, Medical Research Council; FMA, Fugl-Meyer Assessment scale; MI, motricity index; NIHSS, National Institutes of Health Stroke Scale score; FIM, Functional Independence Measure; K-MBI, Korean version of Modified Barthel Index.
HbA1c level: group 1, 5.0%–5.9%; group 2, 6.0%–6.9%, group 3, 7.0%–7.9%; group 4, 8.0%–8.9%; group 5, 9.0%–9.9%. *p<0.05 by chi-square test.
Figure & Data
References
Citations
Citations to this article as recorded by
Chronic regional pain syndrome following calcaneal fractures: what causes it and how may Vitamin C aid? M KAZEZ, M YALIN, A AGAR Acta Orthopaedica Belgica.2024; 90(2): 271. CrossRef
Effect of Prednisolone on Clinical and Cytokine mRNA Profiling in Complex Regional Pain Syndrome Jayantee Kalita, Ruchi Shukla, Prakash C. Pandey Journal of Molecular Neuroscience.2024;[Epub] CrossRef
Prednisolone 20 mg vs 40 mg in complex regional pain syndrome type I: A randomized controlled trial Jayantee Kalita, Prakash C. Pandey, Ruchi Shukla, Usha K. Misra Journal of Clinical Neuroscience.2023; 113: 108. CrossRef
Determinants of complex regional pain syndrome type I in patients with scaphoid waist fracture- a multicenter prospective observational study Hao Gong, Gang Zhao, Yuzhou Liu, Zhengfeng Lu BMC Musculoskeletal Disorders.2022;[Epub] CrossRef
Classification for Staging and Managing Patients with Biopolymer-induced Human Adjuvant Disease Jaime Eduardo Pachón Suárez, Marcela C. Salazar, Victor Z. Rizo Plastic and Reconstructive Surgery - Global Open.2022; 10(2): e4137. CrossRef
Comparisons and Associations between Hip-Joint Position Sense and Glycosylated Hemoglobin in Elderly Subjects with Type 2 Diabetes Mellitus—A Cross-Sectional Study Faisal Asiri, Ravi Shankar Reddy, Bayapa Reddy Narapureddy, Abdullah Raizah International Journal of Environmental Research and Public Health.2022; 19(23): 15514. CrossRef
Effect of myofascial trigger points release with shockwave therapy on shoulder hand syndrome in stroke patients Lama Saad El-Din Mahmoud, Shahesta Ahmed Osama, Lamis Ahmed Osama Physiotherapy Quarterly.2022; 31(2): 59. CrossRef
Beyond ulcers and osteomyelitis: imaging of less common musculoskeletal complications in diabetes mellitus Anuradha Rao, Girish Gandikota The British Journal of Radiology.2018; : 20170301. CrossRef
Molecular signature of complex regional pain syndrome (CRPS) and its analysis Simone König, Tanja Schlereth, Frank Birklein Expert Review of Proteomics.2017; 14(10): 857. CrossRef
Relationship Between HbA1c and Complex Regional Pain Syndrome in Stroke Patients With Type 2 Diabetes Mellitus
Fig. 1 Flow diagram of patients included in this study by CRPS versus non-CRPS groups. DM, diabetes mellitus; CRPS, complex regional pain syndrome; PPN, peripheral polyneuropathy.
Fig. 2 Flow diagram of the five HbA1c groups. DM, diabetes mellitus; HbA1c, glycosylated hemoglobin A.
Fig. 3 CRPS prevalence by HbA1c; as HbA1c increased, CRPS prevalence increased. CRPS, complex regional pain syndrome; HbA1c, glycosylated hemoglobin A.
Fig. 1
Fig. 2
Fig. 3
Relationship Between HbA1c and Complex Regional Pain Syndrome in Stroke Patients With Type 2 Diabetes Mellitus
General characteristics of subjects (n=200)
Values are presented as mean±standard deviation or number of subjects.
DM, diabetes mellitus; HbA1c, glycosylated hemoglobin A.
Comparisons between the CPRS and non-CRPS groups
Values are presented as mean±standard deviation or number of subjects.
DM, diabetes mellitus; HbA1c, glycosylated hemoglobin A; NIHSS, National Institutes of Health Stroke Scale; MRC, Medical Research Council; FMA, Fugl-Meyer Assessment scale; MI, motricity index; FIM, Functional Independence Measure; K-MBI, Korean version of Modified Barthel Index; TPBS, three-phase bone scan; CRPS, complex regional pain syndrome.
Statistically significant as p<0.05. a)Chi-square test, b)independent t-test.
Correlations between CRPS prevalence, age, DM duration, affected shoulder flexor muscle strength, stroke lesion, and stroke cause by HbA1c
Values are presented as number of subjects or mean±standard deviation.
CRPS, complex regional pain syndrome; MRC, Medical Research Council; FMA, Fugl-Meyer Assessment scale; MI, motricity index; NIHSS, National Institutes of Health Stroke Scale score; FIM, Functional Independence Measure; K-MBI, Korean version of Modified Barthel Index.
HbA1c level: group 1, 5.0%–5.9%; group 2, 6.0%–6.9%, group 3, 7.0%–7.9%; group 4, 8.0%–8.9%; group 5, 9.0%–9.9%. *p<0.05 by chi-square test.
Table 1 General characteristics of subjects (n=200)
Values are presented as mean±standard deviation or number of subjects.
DM, diabetes mellitus; HbA1c, glycosylated hemoglobin A.
Table 2 Comparisons between the CPRS and non-CRPS groups
Values are presented as mean±standard deviation or number of subjects.
DM, diabetes mellitus; HbA1c, glycosylated hemoglobin A; NIHSS, National Institutes of Health Stroke Scale; MRC, Medical Research Council; FMA, Fugl-Meyer Assessment scale; MI, motricity index; FIM, Functional Independence Measure; K-MBI, Korean version of Modified Barthel Index; TPBS, three-phase bone scan; CRPS, complex regional pain syndrome.
Statistically significant as p<0.05. a)Chi-square test, b)independent t-test.
Table 3 Correlations between CRPS prevalence, age, DM duration, affected shoulder flexor muscle strength, stroke lesion, and stroke cause by HbA1c
Values are presented as number of subjects or mean±standard deviation.
CRPS, complex regional pain syndrome; MRC, Medical Research Council; FMA, Fugl-Meyer Assessment scale; MI, motricity index; NIHSS, National Institutes of Health Stroke Scale score; FIM, Functional Independence Measure; K-MBI, Korean version of Modified Barthel Index.
HbA1c level: group 1, 5.0%–5.9%; group 2, 6.0%–6.9%, group 3, 7.0%–7.9%; group 4, 8.0%–8.9%; group 5, 9.0%–9.9%. *p<0.05 by chi-square test.