The Modulation of Neurotrophin and Epigenetic Regulators: Implication for Astrocyte Proliferation and Neuronal Cell Apoptosis After Spinal Cord Injury
Article information

Abstract
Objective
To investigate alterations in the expression of the main regulators of neuronal survival and death related to astrocytes and neuronal cells in the brain in a mouse model of spinal cord injury (SCI).
Methods
Eight-week-old male imprinting control region mice (n=36; 30–35 g) were used in this study and randomly assigned to two groups: the naïve control group (n=18) and SCI group (n=18). The mice in both groups were randomly allocated to the following three time points: 3 days, 1 week, and 2 weeks (n=6 each). The expression levels of regulators such as brain-derived neurotrophic factor (BDNF), glial cell line-derived neurotrophic factor (GDNF), nerve growth factor (NGF), histone deacetylase 1 (HDAC1), and methyl-CpG-binding protein 2 (MeCP 2) in the brain were evaluated following thoracic contusive SCI. In addition, the number of neuronal cells in the motor cortex (M1 and M2 areas) and the number of astrocytes in the hippocampus were determined by immunohistochemistry.
Results
BDNF expression was significantly elevated at 2 weeks after injury (p=0.024). The GDNF level was significantly elevated at 3 days (p=0.042). The expression of HDAC1 was significantly elevated at 1 week (p=0.026). Following SCI, compared with the control the number of NeuN-positive cells in the M1 and M2 areas gradually and consistently decreased at 2 weeks after injury. In contrast, the number of astrocytes was significantly increased at 1 week (p=0.029).
Conclusion
These results demonstrate that the upregulation of BDNF, GDNF and HDAC1 might play on important role in brain reorganization after SCI.
INTRODUCTION
Anatomical and functional changes after spinal cord injury (SCI) include both retrograde and anterograde degeneration [12]. SCI results in removal of supraspinal input to the spinal sensory and motor networks, and thus results in permanent and severe sensory and motor dysfunction after injury. However, some degree of functional recovery can be observed after SCI [3]. Since reorganization of injured axons is limited in the mature CNS, spontaneous functional recovery appears to be regulated by reorganization of the spared nervous system. This secondary remodeling occurs at multiple levels of the axis, including the site of SCI, supraspinal tracts, brainstem, and brain hemisphere [4]. Greater structural and functional changes are evident after large-scale injuries such as SCI or limb amputation [56]. PET and EEG in SCI patients have shown reorganization related to functional recovery and changes in subcortical or cortical activation [789].
A few studies have reported changes in the expression of the prohormone convertase, neurotrophins, and related receptors in the injured site following SCI [10]. Epigenetic regulators—histone deacetylase (HDAC) family and methyl-CpG-binding protein (MeCP)—have been shown to play an important role in neurodegenerative diseases and neurological conditions, such as traumatic brain injury (TBI) and stroke [1112]. A recent study reported that the degree and pattern of changes in the brain after SCI were similar to those associated with the chronic neurodegeneration and cognitive deficits observed after TBI in rats [13]. However, since experimental animal studies following SCI have focused on the spinal cord and the pathway, there is little information on the pathophysiologic alterations in the brain level after SCI. A recent experimental study revealed that isolated thoracic SCI causes chronic diffuse inflammation in the brain by increasing numbers of reactive microglial cells, and elevating the expression of microglial cell-related markers [14]. However, although diverse changes in and roles of astrocytes after SCI have been reported, no study to date has addressed their pattern of changes specifically at the brain level.
Therefore, we examined the pattern of change in the expression of the main survival- and death-related regulators of neuronal cells and astrocytes in the brain after SCI.
MATERIALS AND METHODS
Experimental animals
Eight-week-old male imprinting control region mice (n=36; 30–35 g; OrientBio, Seongnam, Korea) were used in this study. All animal care, interventions and euthanasia procedures were in accordance with the National Institutes of Health Guide for the Care and Use of Laboratory Animals and guidelines approved by the Animal Care and Use Committees of Department of Rehabilitation Medicine, Yonsei University Wonju College of Medicine. At the beginning of the experiment, animals were randomly assigned to two groups: the naïve control group (n=18) and SCI group (n=18). The mice in the SCI and control group were randomly allocated to the following three time points: day 3, week 1, and week 2 (n=6 each). At each time point, three of the mice were subjected to Western blot for molecular analysis and the other three were evaluated by means of immunochemistry.
Moderate spinal cord contusion
The prescribed animals underwent a contusive impact SCI induced using an Infinite Horizons device (Precision Systems and Instrumentation, Lexington, NY, USA). Animals were anesthetized with a mixture of ketamine and xylazine (0.05 mL/kg) and absence of blink and withdrawal reflexes were ensured. During surgery, the mice were kept on a homeothermic blanket system (Harvard Apparatus Ltd., Kent, UK) to maintain the body temperature at 37.0℃±0.5℃ as measured by a rectal probe. Following anesthesia, a vertical incision was made along the low thoracic vertebra and the superficial muscle and skin retracted. A laminectomy performed at thoracic vertebra T10 exposed the dorsal surface of the spinal cord without disrupting the dura mater. Stabilization clamps were placed around the vertebrae at T9 and L2 to support the column during impact. Injury was induced using the tip of the impactor probe, which transduces a moderate of 50 kdyne. Feedback from the Infinite Horizons device, including the actual impact force, cord displacement, graph of time versus force, and graph of time versus displacement, were recorded for each animal. After SCI, the muscles were sutured in layers with 5-0 chromic gut, and skin was closed with 7 mm wound clips. After surgery, mice were allowed to recover in a warmed cage with water and food easily accessible. Gentamicin (5 mg/kg, intramuscular; Abbott Laboratories, North Chicago, IL, USA) was administered immediately post-surgery. Animals were doubly housed in Mouse Houses for the duration of the study. Postoperative care consisted of manual bladder expression twice per day until mice recovered some bladder expression, then once per day for the duration of the study.
The mice were maintained for 2 weeks after injury with all brains collected at 3 days, 1 and 2 weeks, for HDAC and MeCP2 related protein, brain-derived neurotrophic factor (BDNF), glial cell line-derived neurotrophic factor (GDNF) and nerve growth factor (NGF) analysis.
Immunohistochemistry
The mice (n=3) in each group were deeply anesthetized as described above, and the thorax was opened. The mice were perfused transcardially with 100 mL of 0.9% sodium chloride, then with 200 mL of 4% paraformaldehyde in 0.1 M phosphate buffer (PB, pH 7.4). The brains were carefully removed from the skull, fixed for 12 hours in the same fixative, and infiltrated with 30% sucrose solution at 4℃ until they sank. The brains were then placed on a brain blocker (David Kopf Instruments, Tujunga, CA, USA). The blocker was then rapidly frozen in 2-methylbutane, chilled on dry ice, and mounted in Tissue-Tek OCT compound (Sakura Finetechnical Co., Tokyo, Japan). Serial coronal sections 24 µm in thickness were obtained using a cryostat microtome (Leica Microsystems Inc., Wetzlar, Germany) and were distributed sequentially into a set of 12 tissue wells containing 0.1 M PB. After a brief wash with 0.1 M PB, the brain sections were transferred to another set of 12 tissue wells containing cryoprotection solution and then stored in a freezer at a temperature below –20℃ until use. The sections were washed three times with 0.1 M PBS and treated with 3% hydrogen peroxide for 15 minutes to suppress endogenous peroxidase activity. After washing with 0.1 M PBS, the sections were treated for 1 hour with 5% normal serum obtained from the same host species to reduce non-specific binding and were then incubated with rabbit anti-NeuN monoclonal antibody (1:400; Chemicon, Temecula, CA, USA) and mouse anti-GFAP (1:400; Abcam, Cambridge, UK) diluted in 0.1 M PBST overnight at 4℃. Sections were washed in PBS and incubated for 1 h with goat anti-rabbit IgG conjugated Alexa 595 and goat anti-mouse IgG conjugated Alexa 488 (1:400; Santa Cruz Biotech, Santa Cruz, CA, USA) for neurons and astrocytes. The numbers of NeuN-positive cells and GFAP-positive cells were counted on coronal sections stained with NeuN and GFAP. Three of 12 sets of samples were randomly chosen from each animal and mounted on gelatin slides. Regions of interest (motor cortex and hippocampus) related to motor control and cognitive function were identified [14].
Western blot analysis
To identify the neuromodulators associated with neuronal cell development, growth, survival and apoptosis, the expression of three specific neurotrophic factors (DNF, NGF and GDNF) in the whole brain was investigated by Western blotting.
To compare the expression levels of epigenetic regulators and neurotrophic factors, mouse brains were lysed in 500 µL of cold RIPA buffer (50 mM Tris-HCl, pH 7.5, 1% Triton X-100, 150 mM NaCl, 0.1% sodium dodecyl sulfate [SDS], and 1% sodium deoxycholate) with a protease inhibitor cocktail (Sigma-Aldrich, St. Louis, MO, USA). Tissue lysate was centrifuged at 13,000 g for 15 minutes at 4℃. The supernatant was harvested, and protein concentration was analyzed using a Quant-iT protein assay kit (Molecular Probes, Eugene, OR, USA). For electrophoresis, 50 µg of protein were dissolved in sample buffer (60 mM Tris-HCl, pH 6.8, 14.4 mM β-mercaptoethanol, 25% glycerol, 2% SDS, and 0.1% bromophenol blue), boiled for 10 minutes and separated on a 10% SDS reducing gel. Separated proteins were transferred onto polyvinylidene difluoride membranes (Invitrogen, Carlsbad, CA, USA) using a trans-blot system. Blots were blocked for 1 hour in Tris-buffered saline (TBS; 10 mM Tris-HCl, pH 7.5, 150 mM NaCl) containing 5% nonfat dry milk at room temperature, washed three times with TBS and incubated at 4℃ overnight with an anti-rabbit polyclonal HDAC1 (1:1000, Santa Cruz Biotech), anti-goat polyclonal MeCP2 (1:1000, Santa Cruz Biotech), anti-mouse monoclonal BDNF (1:1000, Abcam), anti-rabbit polyclonal NGF (1:1000, Abcam), anti-mouse GDNF (1:1000, Abcam), and anti-GAPDH (1:3000, Cell signaling, Boston, MA, USA) antibody in TBST (10 mM Tris, pH 7.5, 150 mM NaCl, and 0.02% Tween 20) containing 5% nonfat dry milk. On the next day, blots were washed three times with TBST and incubated for 1 hour with horseradish peroxidase-conjugated secondary antibodies (1:3000, Santa Cruz Biotech) in TBST containing 3% nonfat dry milk at room temperature. After washing three times with TBST, proteins were visualized using an ECL detection system (Amersham Pharmacia Biotech, Piscataway, NJ, USA).
Image analysis
Light photomicrographic images were acquired using a Nikon Optiphot microscope (Nikon Inc., Tokyo, Japan) fitted with a Nikon digital camera (DXM1200), using the Nikon ACT-1 image capture software (ver. 2.2). NeuN- and GFAP-positive cells in the M1, M2 and hippocampus were measured using the MetaMorph Imaging System (Molecular Device, Sunnyvale, CA, USA). The images were imported into Adobe Photoshop (ver. 7.0, Adobe Systems Inc., San Jose, CA, USA) and were adjusted for brightness and contrast to optimize the clarity.
Statistical analysis
Statistical analysis was performed using the Mann-Whitney U test (GraphPad Prism Software, San Diego, CA, USA). The data are expressed as mean±standard error of the mean. The significance level was set at 5%, and all statistical analyses were performed using the SPSS software (SPSS Inc., Chicago, IL, USA).
RESULTS
Changes in the expression of neurotrophic factors following SCI
Expression of BDNF was significantly elevated in the SCI group compared with that in the control group at 2 weeks after SCI (n=3, p=0.024). However, expression of BDNF was not significantly different compared with that of the control group at 3 days and 1 week after SCI (Fig. 1A, 1B). The level of NGF was elevated in the SCI group at 1 week and 2 weeks and decreased at 3 days compared with that of the control group after SCI; however, the differences were not significant (Fig. 1A, 1C). The level of GDNF was significantly elevated in the SCI group compared with that in the control group at 3 days after SCI (n=3, p=0.042). The expression of GDNF was elevated at 1 and 2 weeks compared with the control group after SCI; however, the differences were not significant (Fig. 1A, 1D).

Neurotrophic factor expression by Western blotting analysis. (A) Representative expressions of BDNF, NGF, and GDNF in the brain after contusion of the spinal cord in mice. (B) BDNF significantly elevated compared with those of control group at 2 weeks after SCI (*p<0.05). (C) Representative expressions of NGF in brain after contusion of the spinal cord in mice. NGF elevated compared with those of control group at 1 and 2 weeks and decreased at 3 days; however, the differences were not significant. (D) Representative GDNF expression in the brain after contusion of the spinal cord in mice. GDNF expression was significantly elevated compared with the control group at 3 days (*p<0.05). Data are plotted as mean±standard error of the mean. BDNF, brain-derived neurotrophic factor; NGF, nerve growth factor; GDNF, glial cell line-derived neurotrophic factor; SCI, spinal cord injury; GAPDH, glyceraldehyde 3-phosphate dehydrogenase. *p<0.05 indicates values significantly different from those of SCI and the control group.
Changes in the expression of epigenetic regulators following SCI
The expression of HDAC1 was significantly elevated at 1 week in the SCI group compared with the control group (n=3, p=0.026). The expression of HDAC1 at 3 days and 2 weeks in the SCI group was not significantly different compared with those in the control group (Fig. 2A, 2B). However, the expression of MeCP2 was not different in the SCI group compared with the control group (Fig. 2A, 2C).
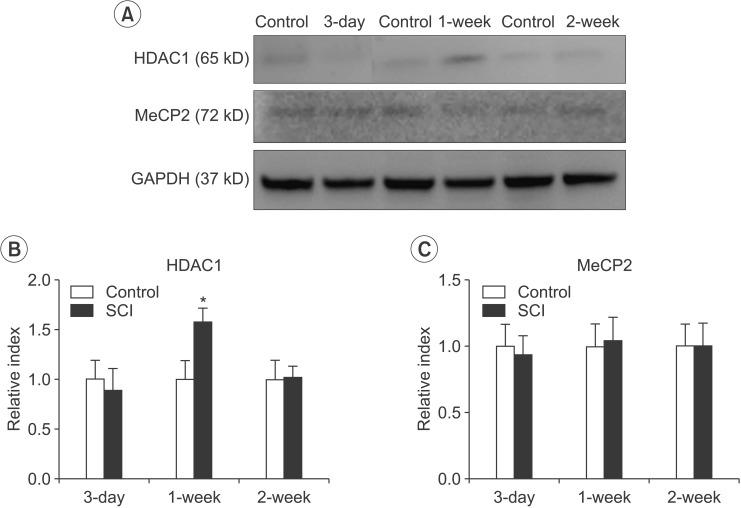
HDAC1 and MeCP2 expression by Western blotting analysis. (A) Representative expressions of HDAC1 and MeCP2 in the brain after contusion of the spinal cord in mice. (B) The difference in the HDAC1 level between the SCI and control groups was significant at 1 week after SCI (*p<0.05). (C) The difference in the MeCP2 level between the SCI and control groups after SCI was not significant. Data are plotted as mean±standard error of the mean. HDAC1, histone deacetylase 1; MeCP2, methyl-CpG-binding protein 2. *p<0.05 indicates values significantly different from those of the SCI and control groups.
SCI mediated change in the number of neurons and astrocytes in the motor cortex and hippocampus
Following SCI, compared to the control, the number of NeuN-positive cells in the M1 and M2 areas gradually and consistently decreased 2 weeks after injury. The number of surviving NeuN-positive cells in the M1 and M2 areas was significantly lower in mice with a SCI (634±100.2) than in the normal controls (1,014±82.65) at 1 week after injury (n=3, p=0.005) (Fig. 3). The number of surviving NeuN-positive cells in the M1 and M2 areas was significantly lower in mice with a SCI (462.2±37.42) than in the normal controls (1,014±82.65) at 2 weeks after injury (n=3, p<0.001) (Fig. 3). In contrast, the number of GFAP-positive astrocytes in the hippocampus significantly increased in SCI mice (100,834±11,423) compared to control mice (62,246±4,253) at 1 week after SCI (n=3, p=0.029). However, the difference in the number of GFAP-positive astrocytes was not significant compared with the control group at 2 weeks after SCI (Fig. 4).

Spinal cord injury (SCI) reduces the number of surviving neurons in the M1 and M2 areas. SCI resulted in significant neuronal cell loss in the M1 and M2 areas at 1 and 2 weeks after injury. (A) Schematic representation of a coronal atlas section of rodent brain corresponding to bregma 1.10 mm. (B) Representative findings of NeuN+ staining in the coronal sections passing through the rostral and caudal parts of the M1 and M2 areas at 1 and 2 weeks after SCI. (C) Higher magnification images of NeuN+ cells in the M1 and M2 areas. (D) The number of NeuN+ cells in the M1 and M2 areas. The total number of NeuN+ cells of the lesioned M1 and M2 areas were significantly lower in the SCI group (*p<0.05). Scale bar represents 500 µm in (B) and 50 µm in (C). *p<0.05 indicates values significantly different from those of the SCI and control groups.

Spinal cord injury (SCI) increases the number of surviving astrocytes in the hippocampus. (A) Representative findings of GFAP staining in the coronal sections passing through the rostral and caudal parts of the hippocampus at 1 and 2 weeks after SCI. (B) The number of GFAP+ cells in the hippocampus. The total number of GFAP+ cells was significantly greater in the SCI group at 1 week compared with the control group (*p<0.05). Scale bar represents 100 µm in (A). *p<0.05 indicates values significantly different from those of the SCI and control groups.
DISCUSSION
In this study, after contusive SCI, proliferation of astrocytes takes place in the hippocampus, and apoptotic cell death of motor neurons occurs in the motor cortex. In addition, the data showed significant upregulation of BDNF, GDNF, and HDAC1 expression.
Mature NTs induce cell survival upon binding to Trk receptors and their immature pro-protein counterparts promote apoptosis via activating p75NTR in the spinal cord [15]. In accordance with these reports, PC enzymes functioning within regulated secretory pathway of neurons and neuroendocrine cells are significantly downregulated in the spinal cord after SCI [16]. In contrast, the expression of pro-NGF and pro-NT3 regulating enzymes is ubiquitous and pro-BDNF is the primary regulator of the secretory pathway of neurons in the spinal cord after SCI [1718]. BDNF has been reported to be an important upstream regulator of long-term potentiation in various brain regions, including the hippocampus and neocortex [19]. Moreover, previous findings suggested downregulation of Nogo receptor and upregulation of BDNF linked to plasticity events in the somatosensory cortex after SCI [20]. One of the novel findings of our study is the significant elevation of BDNF expression at 2 weeks and elevation of GDNF expression at 3 days in the cortex and hippocampus after SCI. These findings suggest that BDNF and GDNF play an important role in astrocyte and neuronal reorganization in the brain after SCI.
Several HDACs are expressed at a high level in the brain, but their role in brain reorganization has not been fully explored. The action of HDACs is opposed by histone acetyltransferases (HATs) such as CREB-binding protein and p300, which catalyze the transfer of an acetyl moiety from acetyl-coenzyme A to specific lysine residues of histones [12]. Acetylation of histones alters the chromatin structure to a state that is transcriptionally active, while histone deacetylation transforms chromatin to a transcriptionally repressed state. Hence, gene expression is regulated, in part, by the balance of HDAC and HAT activities [12]. A recent study showed that neuronal apoptosis induced by HDAC inhibitors involves stimulation of E2F-1, a transcription factor with established proapoptotic activity in neurons [11]. Histone deacetylase-related protein expression is downregulated in apoptotic neurons, and this occurs prior to the time at which these neurons become irreversibly committed to death [11].
We hypothesized that neuronal cell loss in the brain after SCI is associated with the activity of HDAC1. Our data showed significant elevation of HDAC1 level at week 1 in the brain after SCI. To our knowledge, this is the first report that elevation of HDAC1 can be an important epigenetic regulator of neuron apoptosis. However, further research is needed to clarify the inhibition of epigenetic regulators and neurotrophic factors in the brain after SCI.
Recent studies suggest that retrograde degeneration occurs in the spinal cord of SCI patients, and the anatomical changes of the supraspinal central nervous system were clarified [21]. For example, a recent study found in living humans that complete SCI causes anatomical changes in the motor cortex, descending pathways from the motor cortex and anatomical alterations in areas of the brain cortex not directly related to motor control; i.e., the cingulated and medial prefrontal cortices [22]. Furthermore, alteration in the density and morphology of dendritic spines underlies reorganization of synaptic connectivity in the motor cortex after SCI [23]. In this study, motor neuronal cell loss in the M1 and M2 motor cortices was confirmed. Also, surprisingly astrocyte proliferation in the hippocampus was shown. Our study has great significance in that, among the supporting neuronal cells, the importance of the level of astrocytes after SCI was identified. To our knowledge, this is the first report of the reorganization of astrocytes.
Although NGF expression was elevated at 1 and 2 weeks after SCI, the difference was not significant. Also, MeCP2 expression was not significantly different in the SCI group compared to the control group. These results suggest that NGF and MeCP2 likely have little connection with the neuronal reorganization in the brain after SCI.
The subject of this study was the change patterns in the brain after SCI, which is of increasing interest. Brain reorganization after SCI is not simply a progressive phenomenon, but instead involves several temporal phases. Animal and human studies have suggested a relationship between early and late brain reorganization [24]. The results of our study suggest that upregulation of BDNF at 2 weeks, GDNF at 3 days and 1 week and HDAC1 at 1 week are associated with increased astrocyte activity and a neuroprotective mechanism that enhances survival and maintenance of deprived neurons and neuronal circuits in the early phase.
The limitation of this study is that the changes in astrocytes were not evaluated in various parts of the brain, such as the cerebellum, thalamus and other cortices. Also, it was a preliminary study of 2-week duration, which enabled evaluation of the findings only at the acute and subacute phases.
In the future, modifications, such as extending the temporal window or histological analysis of proteins, may be needed to clarify the major protein in the brain after SCI. We plan to explore the pattern of changes of astrocytes in different parts of the brain and evaluate the chronic phase to investigate time-dependent change patterns (phasic or serial). Moreover, research on knockdown of regulators, such as HDAC1, should be pursued to clarify the astrocyte proliferation and neuronal apoptosis in the brain after SCI. The additional information may help to determine whether the neurodegeneration after SCI can be stopped, and will hopefully contribute to clinical recovery, such as pain control and spasticity management.
In conclusion, our results indicate that upregulation of BDNF, GDNF, and epigenetic regulators of HDAC1 might play an important role in the structural pathophysiology after SCI, especially in terms of neurons and astrocytes in the brain.
ACKNOWLEDGMENTS
This study was supported by the Korea Health Technology R&D Project, Ministry of Health & Welfare (No. A100054), the Ministry of Science, ICT & Future Planning (NRF-2010-0016650 and NRF-2014R1A2A1A11052042), and the Yonsei University College of Medicine (No. 6-2014-0036).
Notes
CONFLICT OF INTEREST: No potential conflict of interest relevant to this article was reported.