

INTRODUCTION
The World Health Organization has defined 'falls' as an unintentional, sudden downward movement of the center of gravity, including collision with objects (for example, a chair or stairs) without complete contact with the ground. Falls are a major medical problem that can cause serious injuries, including fracture and brain injury, and may even lead to death. In the public sector in the United States, falls are estimated to cause 17% of all occupationally related injuries and 18% of injuries in general. 'Slipping' is to slide involuntarily and lose one's balance; it is one of the most frequent events responsible for work-related falls. Reportedly, slipping contributes to up to 50% of fall-related injuries [1,2,3,4,5,6,7,8,9]. Slipping can occur when the available friction between the sole and the ground is less than the friction required to propagate [10].
Many studies have been carried out to understand how the human body avoids slipping. McIlroy and Maki [11] reported that a stereotypical compensatory stepping response appeared to maintain balance when a sudden perturbation was applied by forward platform translation. According to research by Cham and Redfern [12], the corrective reaction of the body after a slip is initiated between 190 and 350 ms after heel contact and consists of increasing knee flexion and hip extension activities, with the ankle joint continuing passive movement. A follow-up study by Chambers and Cham [13] showed 1) a relationship between less severe slips and stronger cocontraction at the ankle joint during the heel strike, 2) the critical role of corrective reactions at the knee and the hip in the standing leg for recovery from slips, and 3) earlier onset, longer duration, and greater activity of flexors in the standing leg as adaptations to a slippery surface.
To prevent falls initiated by slipping and to minimize related injuries, it is essential to detect or predict the initiation of the slipping process. To do so, one also needs to understand the differences between slipping steps and steps during normal gait. A recent study monitoring plantar pressure during gait on various surfaces revealed greater toe grip and gentler heel strike on more slippery surfaces. This was thought to increase the vertical direction of the ground reaction force, leading to an increase in available ground friction [10]. Changes in plantar pressure distribution during slipping events were not investigated.
Another study used a motion analysis system to detect falls; by monitoring torso and thigh movements, the researchers suggested that falls can be detected 700 ms before impact [14]. However, such a motion analysis system is not available in occupational or community settings and is not appropriate for detecting falls initiated by slips. Recently, image processing, accelerometers, and inertial measurement units have been introduced to detect falls. However, these methods focus only on the rapid downward movement of the body and do not measure the biomechanical changes of the lower limbs that are related to falls or slip events [15,16,17].
Therefore we aimed to investigate differences in plantar pressure distribution between normal gait and an unpredictable slip event. In particular, we focused on plantar pressure changes during initial heel contact, that is, initial time in both normal step and slipped step. Previous studies have shown that the biomechanical changes of the lower limb during heel strike are related to adjustment on a slippery surface and slip severity [10,13]. We hypothesized that a slipped step would differ from a normal step in terms of plantar pressure distribution during heel contact, and that identifying these differences might allow slips to be detected sooner.
MATERIALS AND METHODS
Study subjects
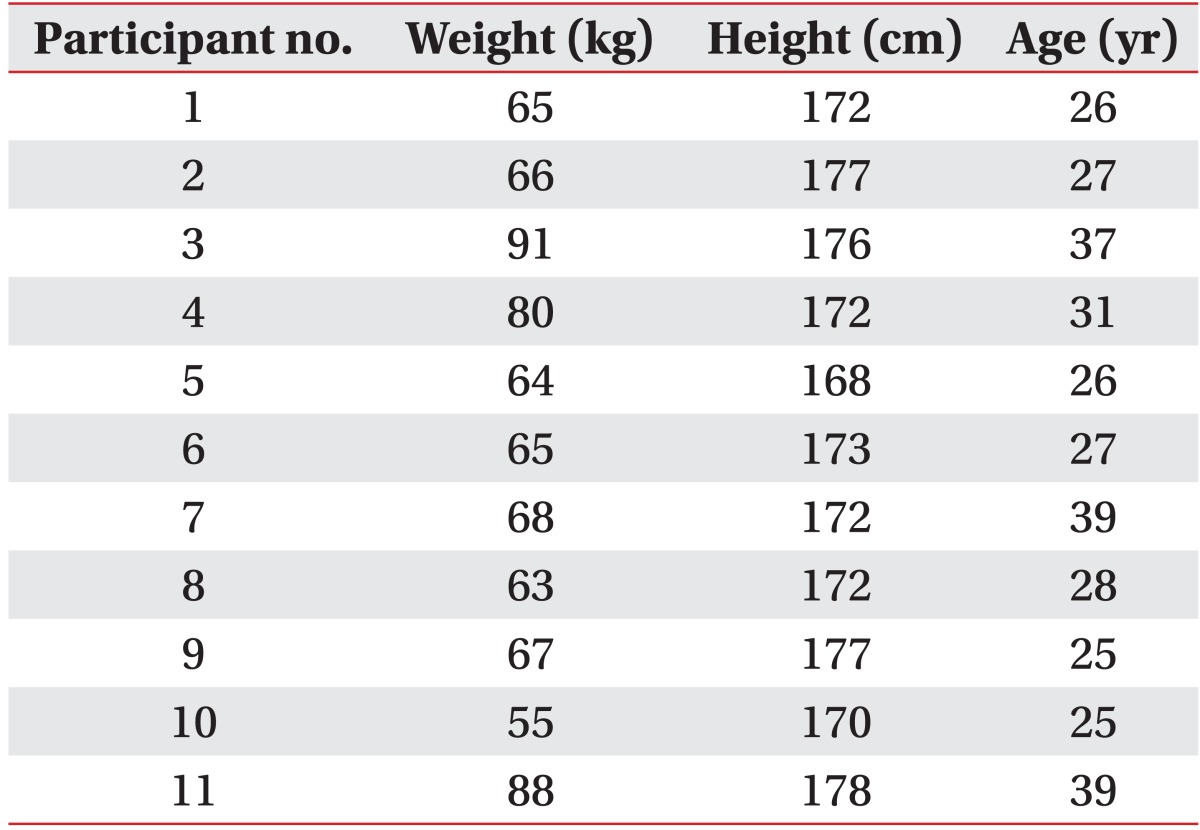
Eleven young adult males were recruited for this study. All participants signed a written consent form, and the study was approved by the Institutional Review Board.
Experimental protocol
Participants all wore a pair of thin socks and running shoes produced by the same manufacturer. Both socks and shoes are commercially available. They also wore a Pedar-C insole plantar pressure measuring system (Novel GmbH, Munich, Germany), the reliability and validity of which have been proven in previous studies [18,19,20]. A fall-arrest harness system attached to an overhead trolley was installed for the participants' safety, but it was loose enough to allow a slipping event. The experiment was conducted under both non-slippery and slippery conditions. To accustom participants to the shoes, insole system, and harness, we asked them to walk on a 4-m path (100 cm × 480 cm) made of wooden plates while they stared at a clock placed 10 m away from the starting line. Following these practice trials, 'non-slippery' trials were conducted twice under the same conditions.
To introduce the slippery conditions, two vinyl sheets, 50 cm × 70 cm, were placed on the walking path. The lubricant WD-40 (WD-40 Co., San Diego, CA, USA) was applied between the two vinyl sheets. We reviewed each participant's previous non-slippery trials to determine the placement of these sheets, which were then positioned in the path of the participant's dominant foot during the slippery trial. The participants were not aware of where the vinyl sheets had been placed on the walking path and were instructed to walk as they did during the non-slippery trials as they performed the slippery trial three times.
Data collection
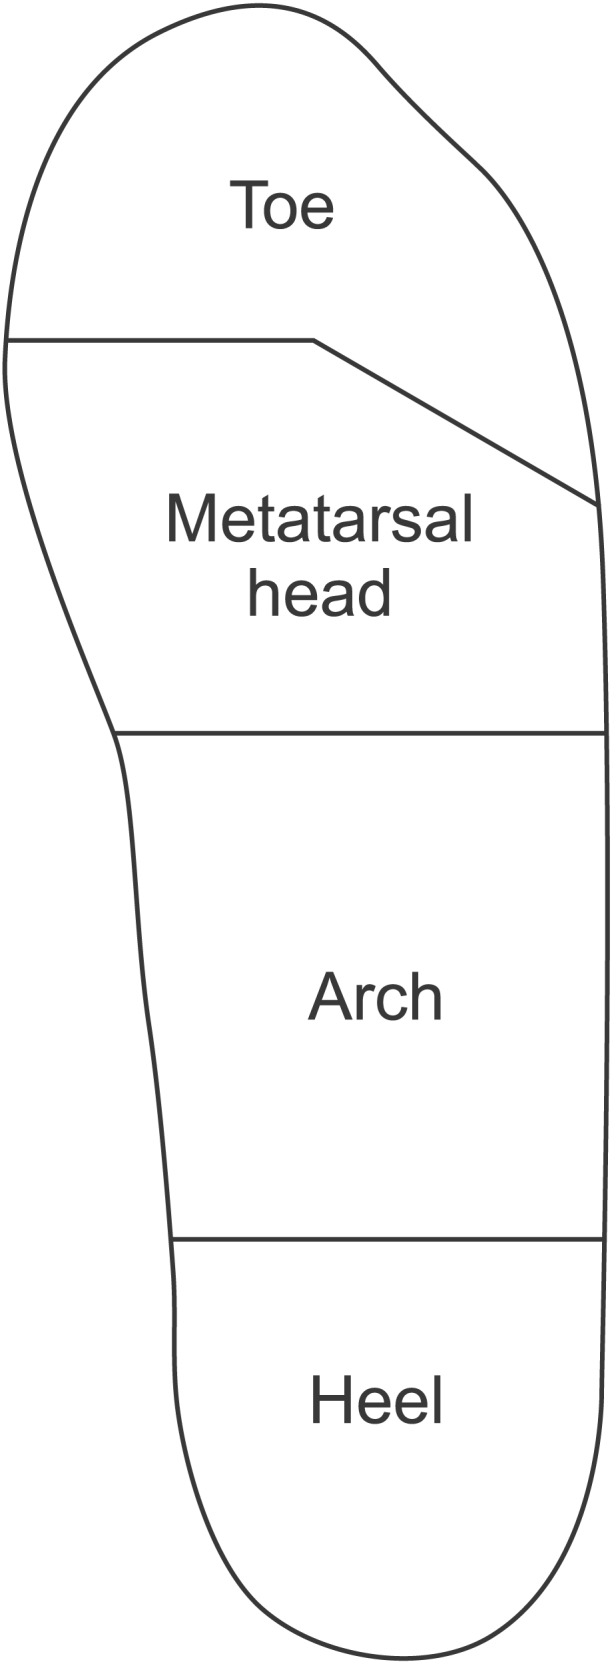
We classified participants' steps into three categories: 1) normal gait step (normal step), 2) step during recovery from slipping (recovered step), and 3) unrecovered slipped step (slipped step). The recovered step was defined as the step in which a participant, having slipped, regained balance without the support of the safety harness. The slipped step was defined as the step in which the participant slipped in a forward direction, causing loss of balance and requiring the support of the harness. We measured plantar pressure in the whole sole and in four different regions: the toes, the metatarsal head, the arch, and the heel (Fig. 1). Plantar pressure data in kPa at 50 Hz were collected for all four regions. The results for peak pressure (PP), contact time (CT), pressure-time integral (PTI), and instant of peak pressure (IPP) were obtained directly from the equipment and were then analyzed.
Statistical analysis
One-way analysis of variance (ANOVA) was performed to examine regional differences in plantar pressure distribution. Post hoc pair-wise comparisons were used to detect differences. A p-value of less than 0.05 was considered statistically significant. Data analyses were performed using the SPSS program for Windows, version 18.0 (SPSS Inc., Chicago, IL, USA).
RESULTS
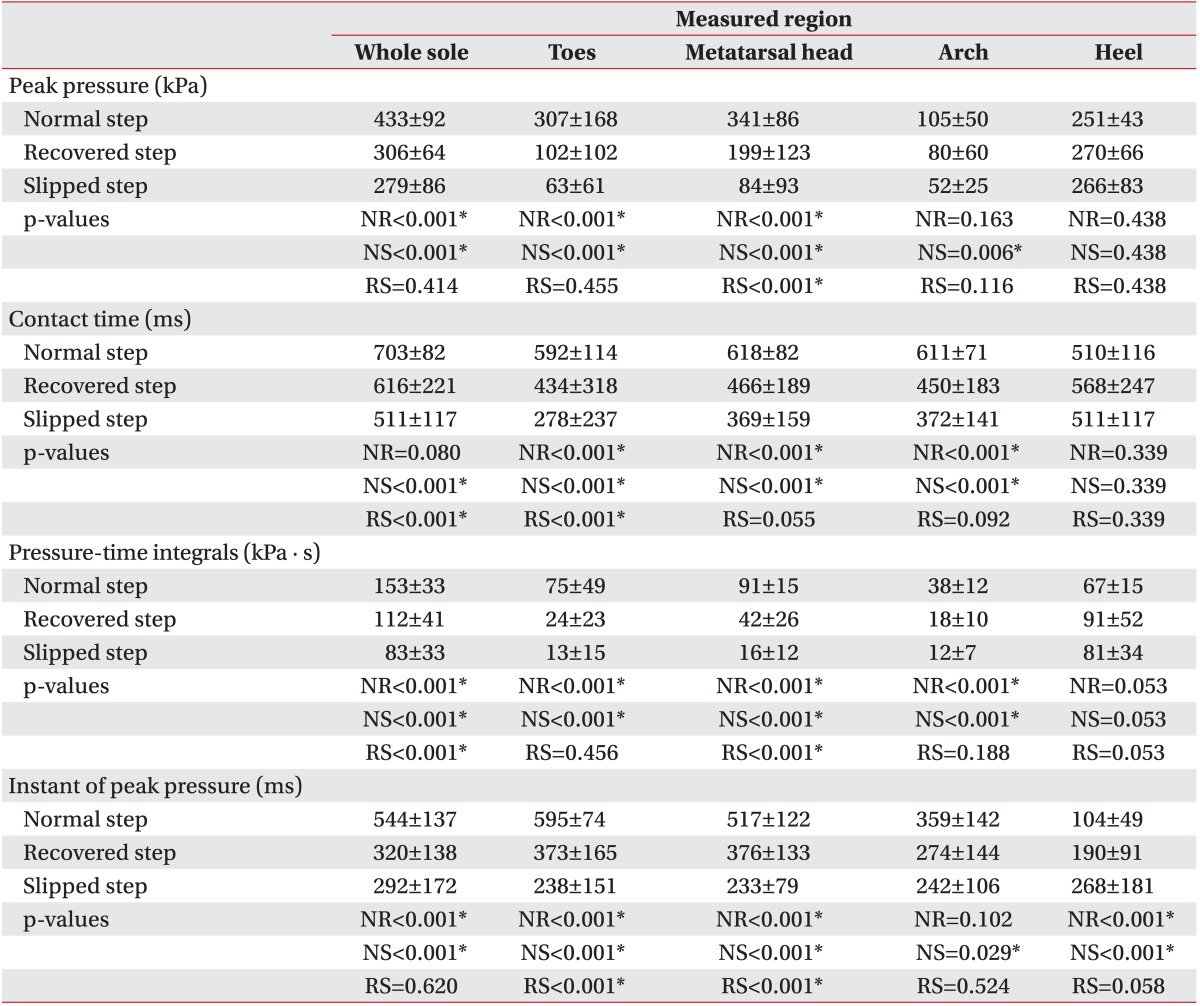
Participants' mean age was 30.0±5.6 years, and mean height and weight were 173.4±3.2 cm and 70.2±11.2 kg, respectively. Demographic data for all the participants are shown in Table 1. Data were collected for 55 trials (22 under non-slippery conditions and 33 under slippery conditions). Of these, we analyzed 51 trials (22 normal steps, 16 recovered steps, and 13 slipped steps). Four recovered steps under slippery conditions were excluded because the participant hesitated or adopted an unnatural posture or gait out of fear of slipping. The overall results are presented in Table 2.
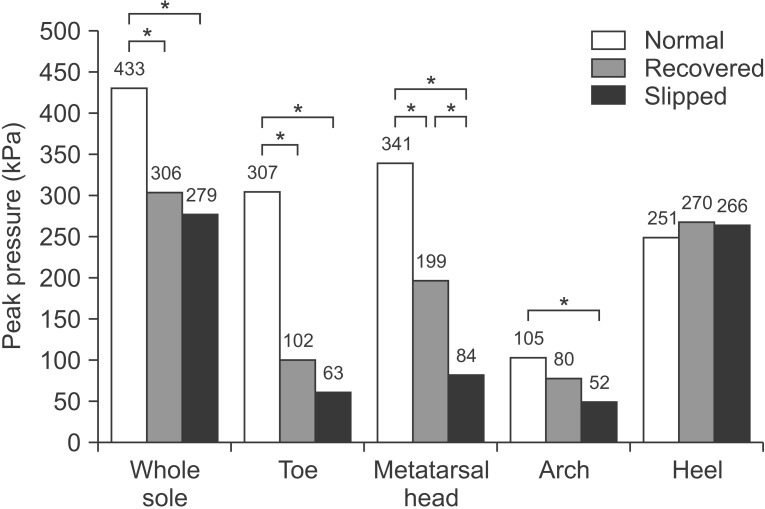
Peak pressure
PP of the whole sole and the toes was highest in the normal step and did not differ significantly between recovered steps and slipped steps. In the metatarsal head, PP differed significantly among the three types of steps, with PP being greatest in the normal step, followed by the recovered step and then the slipped step. With respect to PP in the arch, there was a significant difference only between normal steps and slipped steps. There were no significant differences in PP of the heel among the three types of step (Fig. 2).
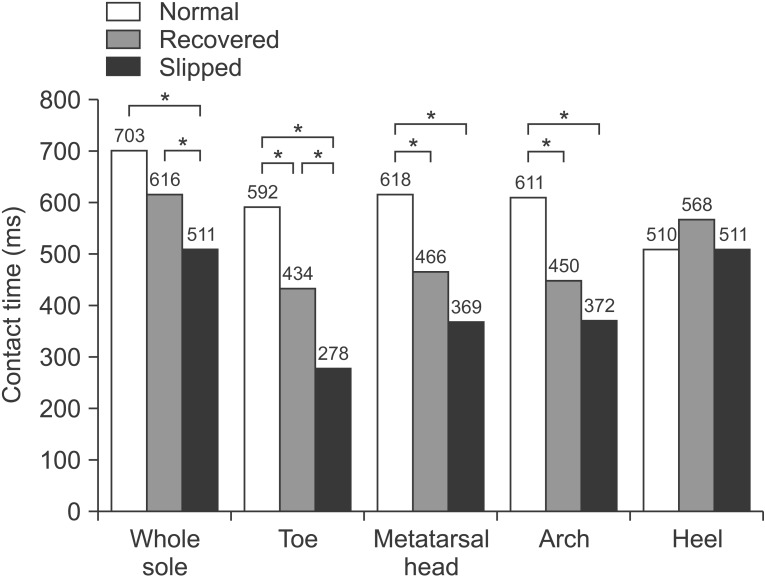
Contact time
When we analyzed CT in the whole sole, there was a significant difference between the recovered step and the slipped step. There were also significant differences in the CT for the toes among the three types of step, that is, the normal step had the greatest CT, followed by the recovered step, and finally the slipped step. In the metatarsal head and arch, the CTs of the normal step were significantly longer than those of the recovered step and the slipped step. CT for the heel was longer in the recovered step than in the other two types of step, but the effect was not statistically significant (Fig. 3).
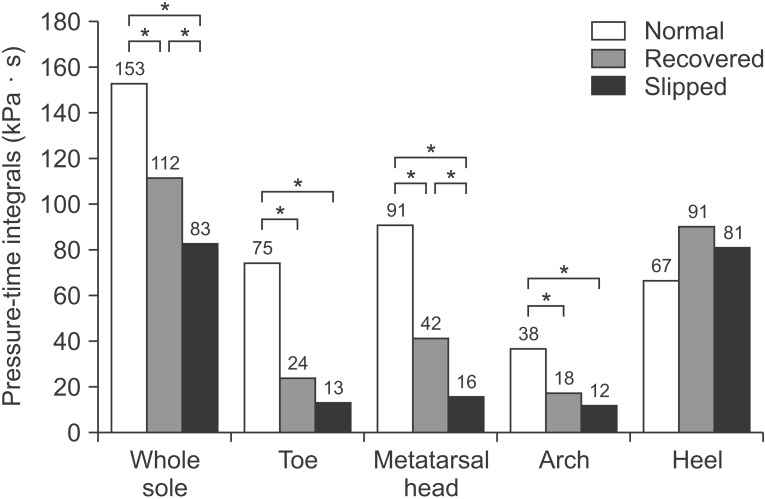
Pressure-time integrals
PTI is an integral of the pressure over the step, and the differences in PTI among the three groups tended to resemble the findings for PP and CT. For both the whole sole and the metatarsal head, PTI was greatest in the normal step, followed by the recovered step, and then the slipped step. PTIs in the toes and arch of the normal step were greater than those of the other two types of step. However, there were no significant differences between the steps in the PTI of the heel. Overall, the differences in PTI among the three step types seemed more prominent than the differences in the PP and CT measures (Fig. 4).
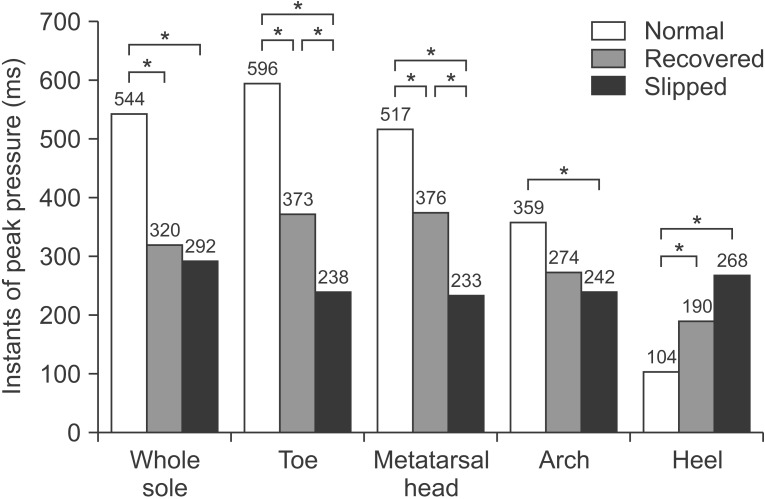
Instant of peak pressure
The IPP is the point in time at which the pressure is maximal. For the whole sole, the IPPs of the recovered step and the slipped step occurred earlier than the IPP of the normal step. In the toes and metatarsal head, the IPP occurred earliest in the slipped step, but it also occurred earlier in the recovered step than in the normal step. The IPP in the arch was only significantly advanced in the slipped step, not in the recovered step. The IPP for the heel was unique, with the IPP delayed in the slipped and recovered steps relative to the normal step, whereas the opposite result was observed in the other regions (Fig. 5).
DISCUSSION
Falls caused by slips occur in a very short time frame, with the slipping velocity at the heel greater than 1 m/s [21]. This makes accurate analysis of the slipping process extremely difficult. Most previous research was confined to the timing of the corrective response of the human body, understanding the corrective response in terms of muscle activation, finding the differences in plantar pressure patterns on surfaces of different friction, and analyzing plantar pressure during a complete step [10,12,13]. To our knowledge, this is the first study to investigate the changes in plantar pressure distribution during the three different steps involved in slipping.
During slipping events, the sole slides over the ground with a velocity exceeding 1 m/s, interfering with the full weight-bearing observed during normal gait. As a result, PP would be lower, CT shorter, and PTI smaller during the slipping, and our study showed comparable results in the toes, the metatarsal head, and the arch. When we analyzed PP, CT, and PTI in the heel area, there were no significant differences among normal, recovered, and slipped steps.
IPP occurred earliest in the slipped step and latest in the normal step in the toes, metatarsal head, and arch. However, we found a unique plantar pressure pattern in the heel as compared with other parts of the sole. IPP was earliest in the normal step and latest in the slipped step in the heel in contrast to the other areas we analyzed. This result was thought to be the consequence of an increase in knee flexion momentum, which had been observed in a previous study using motion analysis [12]. Following recovery from slipping and the transition to a normal gait, the pressure center shifts to the anterior, and the IPP in the heel is less delayed in the recovered step than in the slipped step. This implies that the heel has an important role in slip events.
As mentioned previously, the aim of this study was to examine the possibility of establishing an algorithm to detect or predict falls initiated by slipping. In this study, IPP in the heel had the most distinctive pattern, with the greatest delay in slipped steps, followed by recovered steps. In all other regions, including the toes, metatarsal head, and arch, the IPP occurred earliest in the slipped step, followed by the recovered step. This variation in IPP pattern in the heel may be the key to developing an algorithm for detecting slips. Because the variation in IPP was relatively large, we decided that it would be better to use the ratio between IPP in the heel and in the forefoot instead of the IPP for a single region. Of the two forefoot regions measured (the toes and metatarsal head), we chose the IPP in the metatarsal head for detecting slips in advance. The mean ratios of the metatarsal head IPP to the heel IPP were 6.18±3.10 in the normal step, 3.11±3.07 in the recovered step, and 2.16±2.51 in the slipped step. The IPP ratio in the normal step was significantly different from the IPP ratios in the recovered step (p=0.023) and in the slipped step (p=0.001). There was no significant difference in the IPP ratios between the recovered step and the slipped step.
Therefore, use of the IPP ratio may allow one to distinguish the slipping step (either recovered or not) from the normal step simply by recording the IPP at the heel and at the metatarsal head during gait. Immediately after determining the PP of the metatarsal head, the ratio of the metatarsal head IPP to the heel IPP can be computed. If the IPP ratio at the particular step is significantly earlier than the normal value, we may conclude that slipping is happening at that moment. A larger sample stratified by age, gender, height, and weight will be needed to investigate the normal IPP value and the cut-off point that determines the slipping event. The mean IPP of the metatarsal head in the normal step was 517±122 ms, meaning that by using the above ratio, we may detect or predict slips about 600 ms after the heel strike.
This is the first study to attempt to detect or predict slips by using plantar pressure measurements. However, it was a pilot trial with a small sample size, and only young male adults participated. Further study with a larger, more heterogeneous sample covering both genders and various ages is warranted to confirm our results and to establish more precise values. Another limitation of this study was the use of an insole monitoring system, which could have affected the biomechanics between the sole and the shoes. To minimize the influence of the insole system, we conducted practice trials under non-slippery conditions until the participants felt comfortable. Once a more accurate algorithm is obtained from a more extensive study, it may be possible to develop a more practical system.
Ideally, this system would have two plantar pressure sensors-one in the metatarsal head and one in the heel-as well as a microprocessor to analyze data. In addition, a wearable airbag system could be used for protection by connecting with microprocessor [22,23]. Along with refining the monitoring system, further studies are required to check the validity and reliability of our system.
In conclusion, a distinctive plantar pressure pattern in the heel might be used to predict the timing of a slip event. Slip events can be detected within 600 ms from the heel strike during normal walking. This approach could be used for early detection of slip events to prevent or minimize slip-related injury.