Changes in Lower Extremity Muscle Quantity and Quality in Patients with Subacute Stroke
Article information

Abstract
Objective
To analyze the changes in muscle mass and quality with time on the paretic and non-paretic sides in subacute stroke patients and identify correlations between the variation of muscle mass and quality and lower limb functions.
Methods
Thirty hemiplegia patients diagnosed with stroke participated in this study. To evaluate poststroke muscle changes, longitudinal measurement of muscle mass and quality was conducted with bilateral lower limbs. The elastic shear modulus was measured using shear wave elastography and muscle thickness (MT) of rectus femoris, vastus intermedius, vastus lateralis (VL), vastus medialis, tibialis anterior, and gastrocnemius (GCM) muscles. Functional evaluation was performed using Berg Balance Scale (BBS), Five Times Sit to Stand Test (FTSST). Follow-up was performed at discharge. The muscle mass and quality were compared according to time. We analyzed whether muscle quantity and quality were related to function.
Results
MT demonstrated no significant change with time. The elastic shear modulus increased significantly in the paretic VL and GCM muscles and did not change significantly in the muscles on the non-paretic side. Correlation analysis detected that elastic shear modulus in the VL has a cross-sectional negative relationship between BBS and positive relationship between FTSST. There were significant correlation between variation of FTSST and the variation of the elastic shear modulus in VL.
Conclusion
Only paretic VL and GCM muscle quality changed in subacute stroke patients and muscle’s property related to lower limb functions. Therefore, the lower extremity requires an approach to muscle quality rather than quantity for subacute stroke patients.

INTRODUCTION
Stroke is a leading cause of disability in adults, and many survivors manifest difficulties in performing the activities of daily living independently [1]. The prevalence of sarcopenia is extensively higher in stroke patients [2,3] and such reduction in muscle mass tends to be more prominent on the paretic than that on the non-paretic side. The causes of this involve multidimensional factors including disuse atrophy due to physical inactivity or altered central neural innervation [4].
In cross-sectional studies on chronic stroke patients, the lean mass of the paretic limb showed a significant reduction. In a computed tomography study, the mid-thigh muscle area showed a 20% reduction [5]. Few studies were conducted to assess the functional alteration in muscle tissues by analyzing the structural changes in muscles in addition to a quantitative analysis of muscle atrophy. In chronic stroke patients, the echo intensity (EI) of ultrasound imaging in lower extremity muscles was higher compared to that in healthy controls [6,7]. In several longitudinal studies on chronic stroke patients, the muscle EI in poststroke patients was shown to increase [8,9]. As the value of EI in skeletal muscle increase, it reflects that the fibrosis and fatty infiltration has progressed. Stroke patients with muscle loss displayed lower levels of function [10] and daily living independence [11] at discharge, which highlighted the need to aim for a better functional outcome through suitable rehabilitation and dietary changes based on an early evaluation of the muscle quantity and quality in stroke patients. Nonetheless, previous studies of muscle loss after stroke was cross-sectional surveys or chronic patient groups. And several studies have focused on the relationships between changes in upper limb muscle quality and functions. But few studies have identified a direct association between lower extremity muscle changes and lower extremity function. Thus, this study aimed to analyze the longitudinal changes in muscle mass and quality on the paretic and non-paretic sides in subacute stroke patients and to identify correlations between muscle mass and quality and lower limb functions.
METHODS
This observational longitudinal study recruited participants who diagnosed with ischemic or hemorrhagic subacute stroke who underwent rehabilitation treatment through admission between September 2022 and March 2023. Measurement of muscle mass, quality and functional evaluation were conducted with bilateral lower limbs at baseline. And follow-up data were collected at discharge. During admission, all patients underwent conventional rehabilitation therapy (twice a day, 30 minutes per session) for six sessions a week.
The inclusion criteria were (1) patients with the first episode of ischemic or hemorrhagic stroke; (2) patients of ≥18 years of age; (3) patients with unilateral stroke; (4) patients within six months of stroke; and (5) patients with premorbid independent gait. The exclusion criteria were (1) patients with a limitation in premorbid gait and balance; (2) patients with a comorbidity that could affect the variables (such as nerve root disease, renal disorder, orthopedic problem, and uncontrolled psychiatric illness); (3) patients with a limitation in the body composition analysis due to a pacemaker or a metal implant in the trunk or limb; (4) patients with cognitive decline and consequent inability to follow simple instructions; and (5) patients with severe visual or auditory impairment. For baseline characteristics, the data on age, sex, body mass index, type of stroke, duration since stroke, comorbidity, serum protein, and albumin level were collected and the nutritional state was divided into oral intake and tube feeding. For the muscle quality and quantity as well as functional evaluation, measurements were recorded at baseline and discharge for comparison. All patients were given explanations of the study flow and submitted a written informed consent before participation. This study was approved by the Institutional Review Board at Samsung Changwon Hospital (IRB No. SCMC 2022-07-003).
Measurement of lower limb muscle mass
Ultrasound images were obtained via B-mode ultrasound imaging (Samsung Medison V8; Samsung Healthcare) with a multi-frequency linear transducer (8–12 MHz). In all measurements, the following settings were applied: a frequency of 45 Hz, gain of 61 dB, and depth of 4.5 cm. The images were obtained for the rectus femoris, vastus intermedius (VI), vastus lateralis (VL), vastus medialis (VM), tibialis anterior (TA), and gastrocnemius (GCM) muscles on the paretic and non-paretic sides. Table 1 shows the ultrasound examination protocols for patient posture and site for each muscle [9,12]. In all measurements, a gel was used to avoid excessive pressure on the skin surface. To assess lower limb muscle mass, electronic calipers were used to measure muscle thickness (MT) at each position. The thigh circumference (TC), calf circumference (CC), and body composition were measured on both paretic and non-paretic sides. For the TC, the records were taken from the midway between the lateral condyle of the femur and the greater trochanter [13]. For the CC, the maximal value upon vertical wrapping of the leg axis with a flexible tape was measured as the patient had the foot and ankle relaxed and the knee at 90° flexion in a supine position [2,14]. For the body composition, a non-invasive multifrequency bioimpedance device (InBody S10; InBody) was used. Four electrodes were each placed at the upper and lower limbs, and measurements were recorded using an identical protocol. The recorded data were fat mass, fat mass index, fat-free mass, fat-free mass index, skeletal muscle mass, percentage body fat, and appendicular skeletal muscle mass/height2.

Measurement positions and sites for the trunk and lower limb muscles
Measurement of lower limb muscle quality
As measure lower limb muscle quality, we used shear wave elastography that is a qualitative method to record real-time measurements of the viscoelastic property in soft tissues. The elastic shear modulus (kPa) and shear wave velocity (SWV) are higher in stiffer tissues [15,16]. In this study, we obtained elastic shear modulus (kPa) to evaluate quality of muscles. The probe was positioned longitudinally with respect to the fascicle direction of muscle [17,18], while the measurements were recorded in the circular region of interest (ROI) of 1 mm radius in the muscle (Fig. 1). The mean of eight ROI measurements was estimated for subsequent analysis [19].
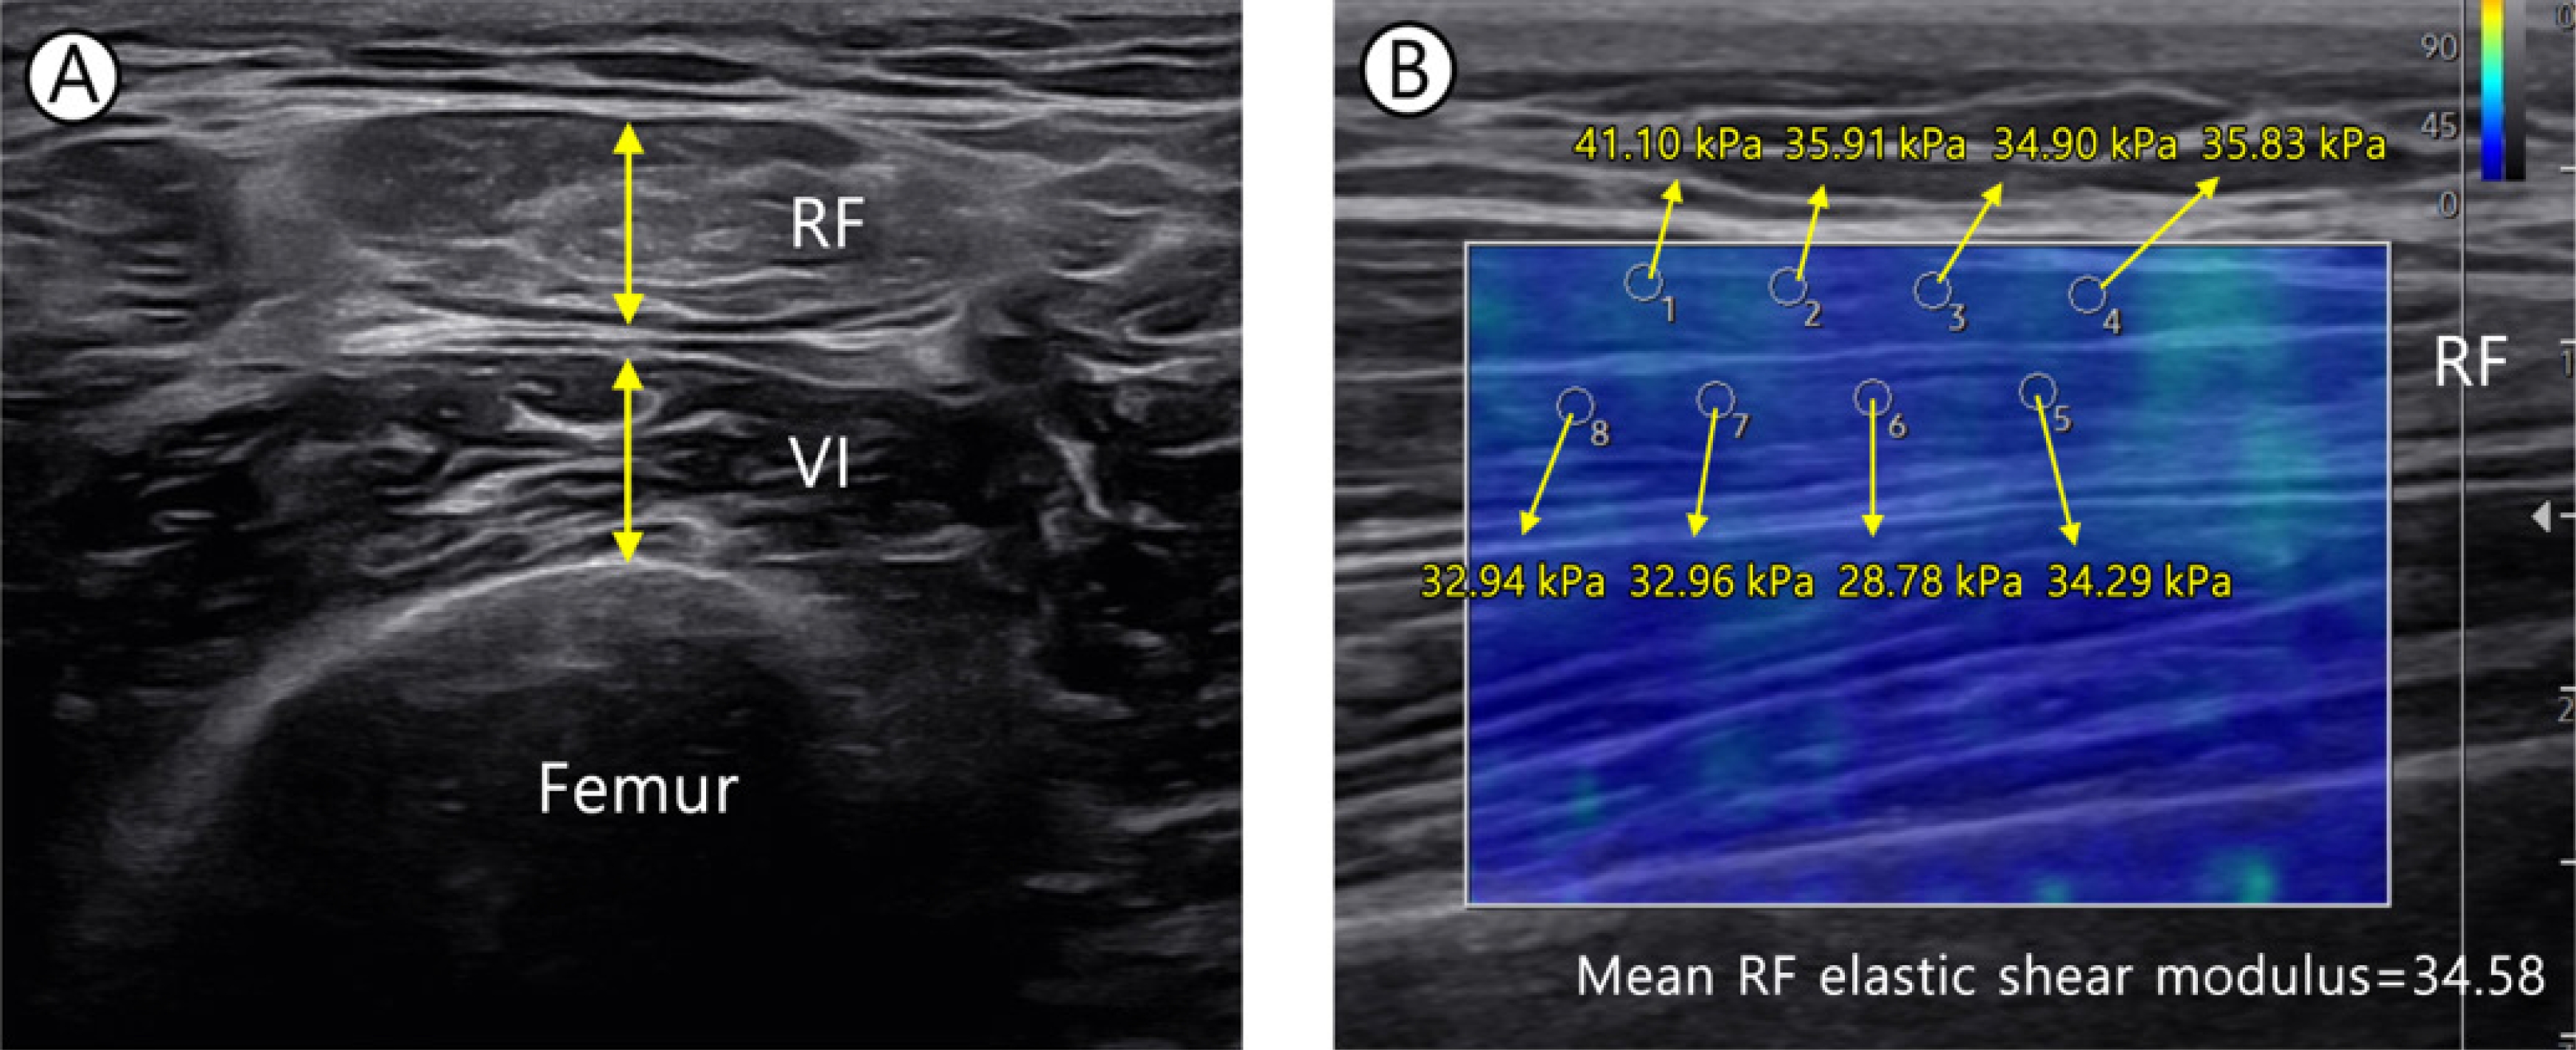
Measurement of thickness or rectus femoris (RF) and vastus intermedius (VI) muscle (A) and elastic shear modulus (B). The circles represent the region of interest (ROI) from which elastic shear modulus (kPa) was measured. The average of eight ROIs was used for analysis.
Measurement of lower limb function
The Berg Balance Scale (BBS) was used in functional evaluation. As a scale of an objective assessment of balance ability, the BBS consists of 14 items regarding balance movements on a 5-point (0–4) scale [20]. In certain patients whose gait disability was not severe, the Five Times Sit to Stand Test (FTSST) and the 10-Meter walk test (10MWT) were performed and the mean of triplicate measurements were recorded for each test. For the 10MWT, the patient walked 14 m and the time taken to walk middle 10 m excluding the 2 m at the start and the 2 m at the end was measured. All evaluations were performed twice at baseline and follow-up.
Statistical analysis
To analyze the longitudinal changes in MT, elastic shear modulus, and body composition variables, Wilcoxon signed-rank test was used. To identify the correlations across the changes of MT, elastic shear modulus, and lower limb functions, Spearman’s correlation was used. To verify the effects of demographics and clinical data on the significantly changed MT and elastic shear modulus, linear regression analysis was performed. The Stata 14.0 (Stata Corp.) program was used in all analysis. A p-value of <0.05 was considered statistically significant.
RESULTS
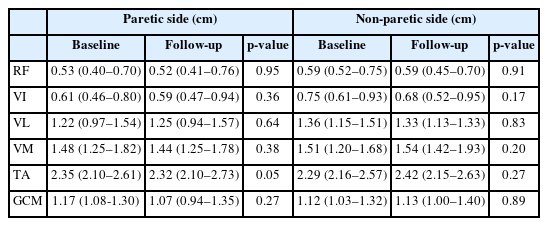
A total of 36 patients satisfied the inclusion criteria, six of whom were excluded from the follow-up due to other medical problems or early discharge, leaving 30 participants. The data of 30 patients were analyzed (male/female, 14/16; age, 72 [62–80] years). The quantitative variables of demographics were expressed as mean (IQR) (Table 2). The duration from stroke onset to examination was 9.00 (6.00–12.00) days and the follow-up interval was 30 (21–47) days. The MT demonstrated no significant change according to time in all target muscles (Table 3). The elastic shear modulus (kPa) increased significantly in the paretic VL and GCM muscles (p<0.001, p=0.03, respectively) whereas it did not change significantly in the muscles on the non-paretic side (Table 4).
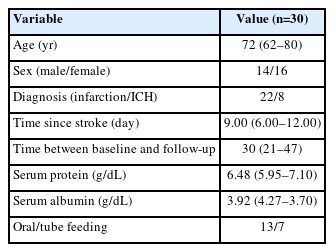
Demographic and characteristics of patients
Changes in muscle thickness at baseline and follow-up (n=30)

Changes in elastic shear modulus at baseline and follow-up (n=30)
The lower extremity circumference measurements did not show significant changes, and in the comparison of functional outcome between baseline and follow-up, the BBS, FTSST, and 10MWT showed significant improvements (p<0.001, p=0.005, and p=0.01, respectively). The body composition measurements including the fat mass, skeletal muscle mass, percentage body fat, and appendicular skeletal muscle mass/height2 showed no difference between baseline and follow-up (Table 5).
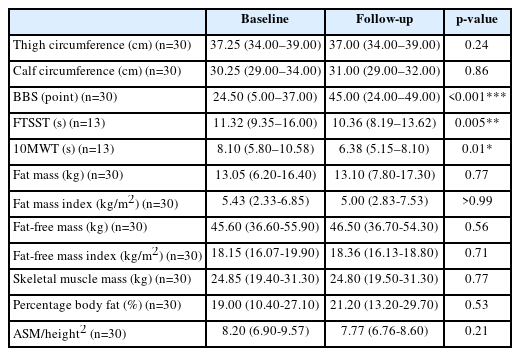
Functional evaluation and circumferences at baseline and follow-up
Correlation analysis detected a significant negative correlation between BBS and the elastic shear modulus in the VL at the baseline and follow-up (p=0.008 for baseline and p=0.007 for follow-up). A significant positive correlation was found for the FTSST and the elastic shear modulus in the VL (p=0.002 for baseline and p=0.041 for follow-up). The elastic shear modulus of TA and GCM showed a significant correlation with FTSST only at the follow-up (p=0.031 and 0.009, respectively), not at the baseline (Fig. 2).
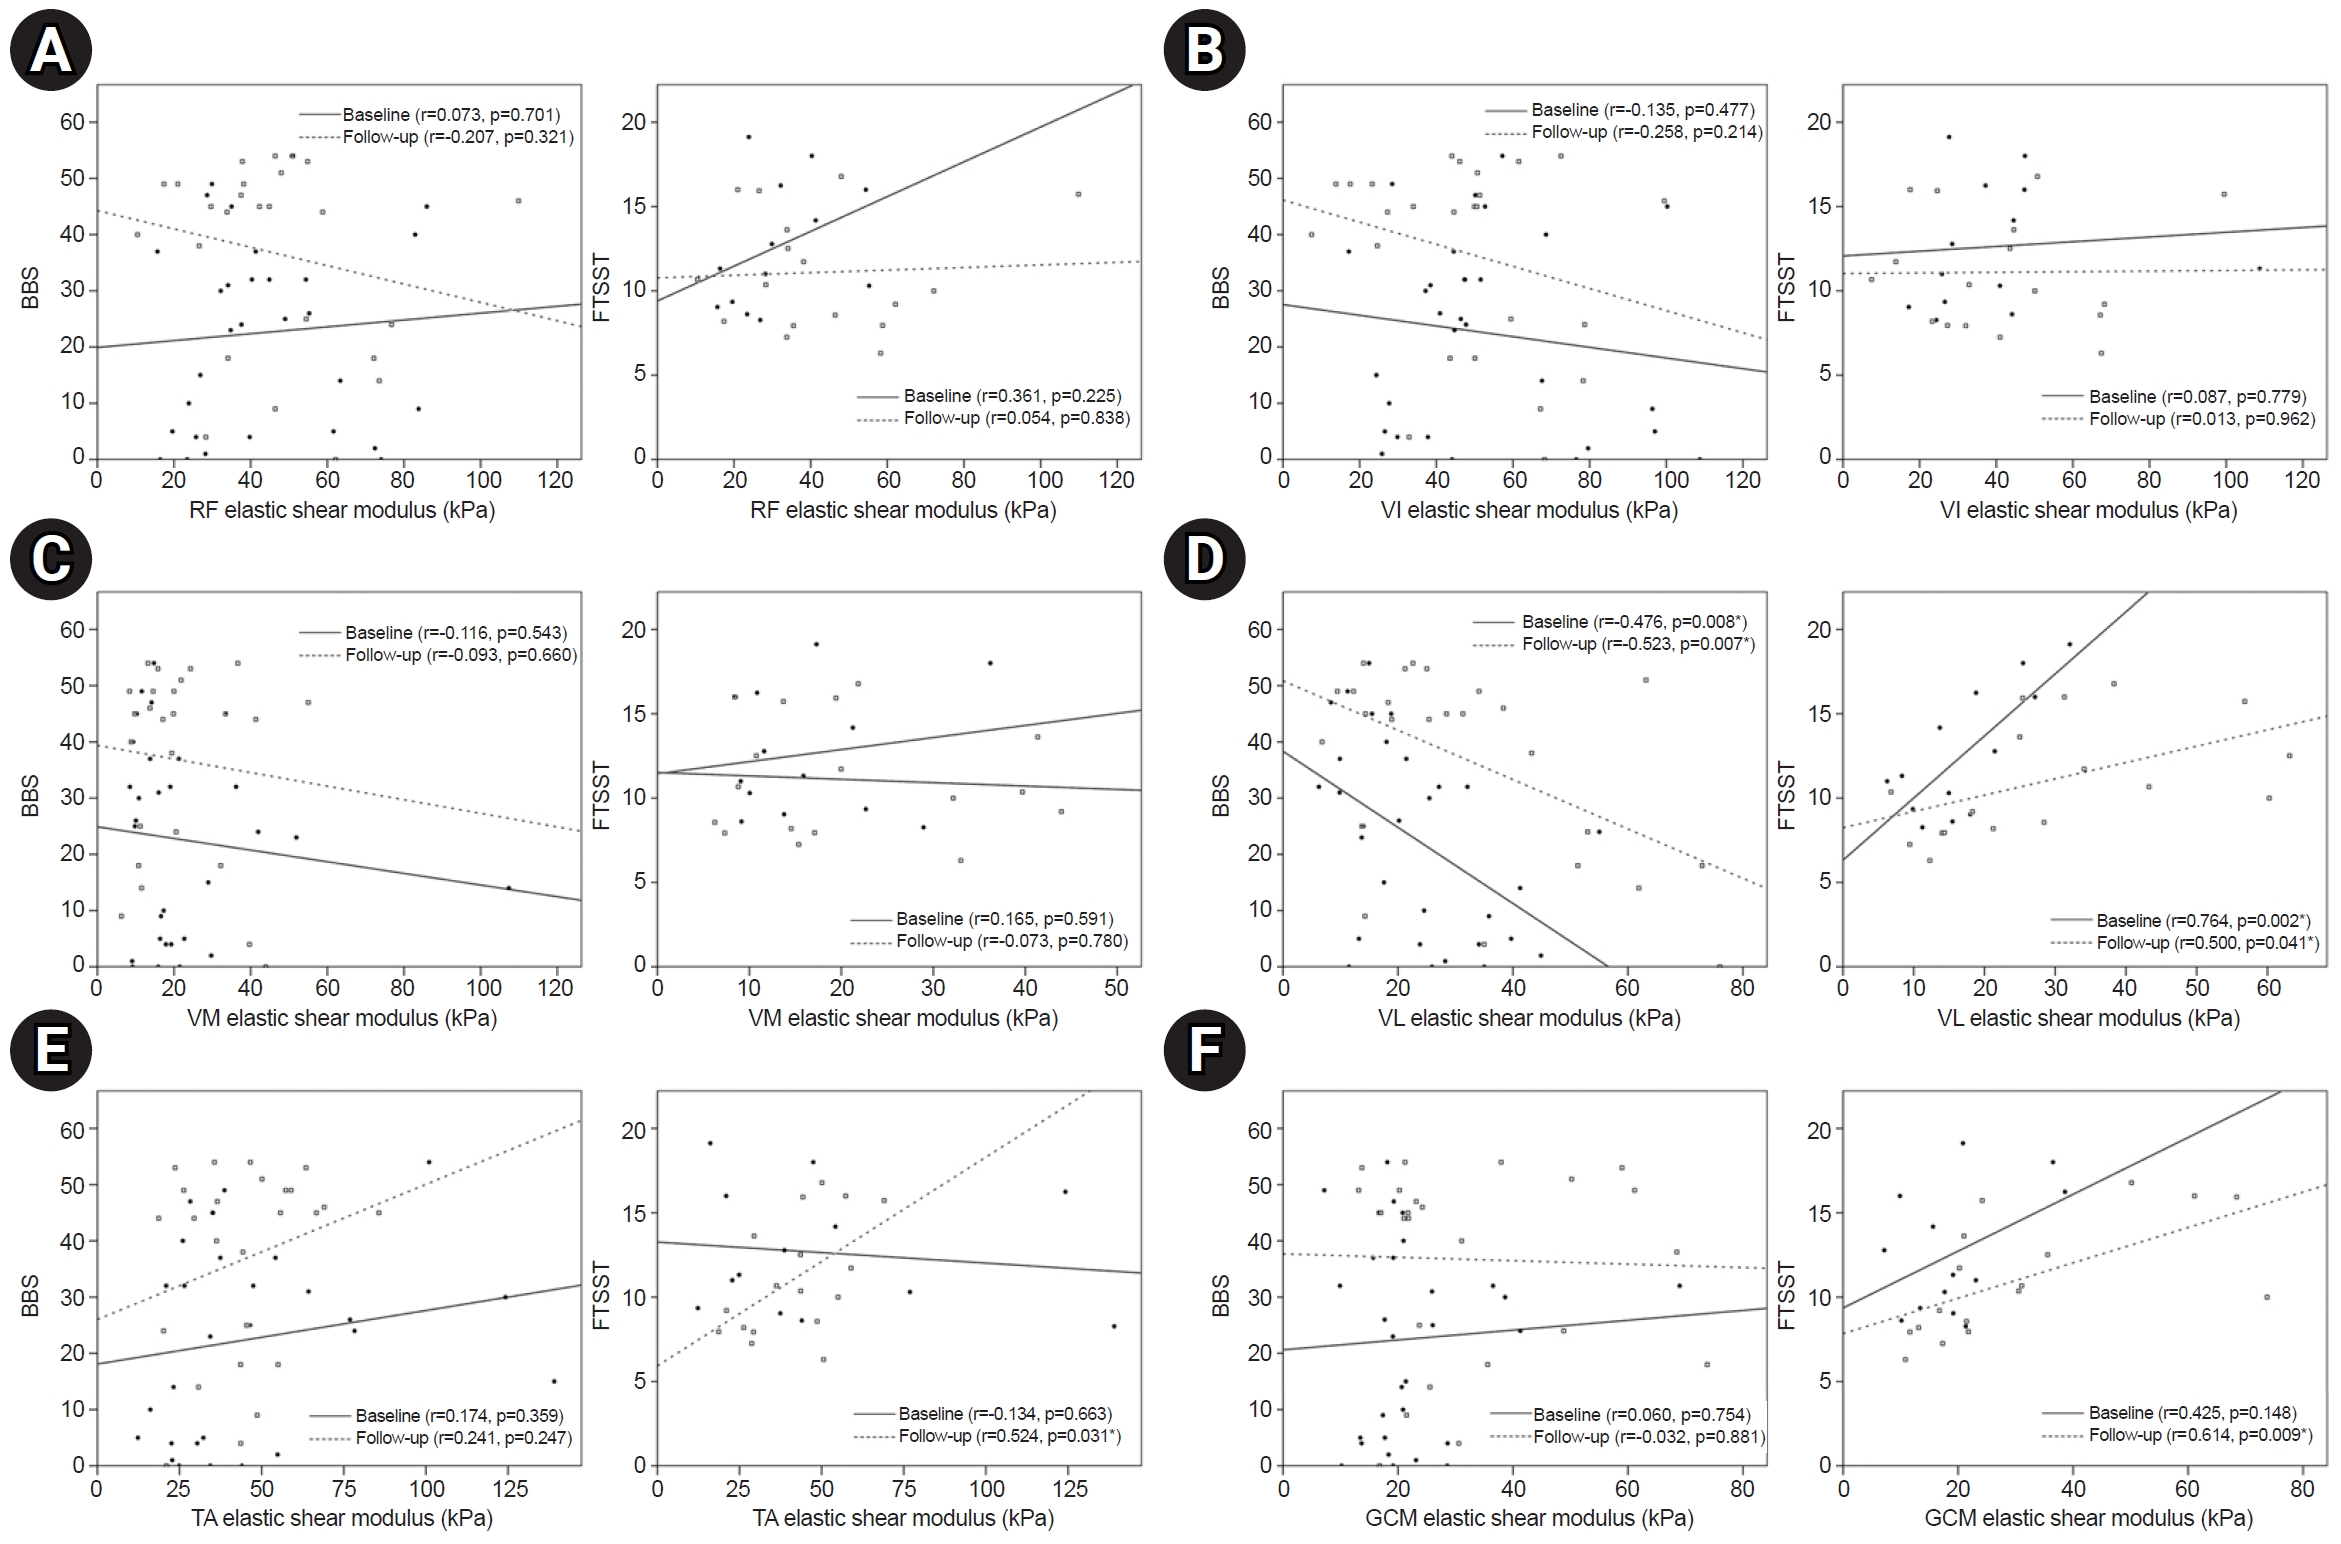
Cross-sectional correlation between lower limb functions and elastic shear modulus (kPa) of each muscle: rectus femoris (RF) (A), vastus intermedius (VI) (B), vastus medialis (VM) (C), vastus lateralis (VL) (D), tibialis anterior (TA) (E), and gastrocnemius (GCM) (F). BBS, Berg Balance Scale; FTSST, Five Times Sit to Stand Test. *p<0.05.
An analysis of longitudinal changes in muscles with significant changes between baseline and follow-up was also conducted. There was significant correlation between variation of FTSST and the variation of the elastic shear modulus in VL (p<0.001). However, difference of BBS was not significantly correlated with the difference of elastic shear modulus in VL (Fig. 3). Variations in VL and GCM muscle quality according to demographic data did not exhibit a significant correlation.
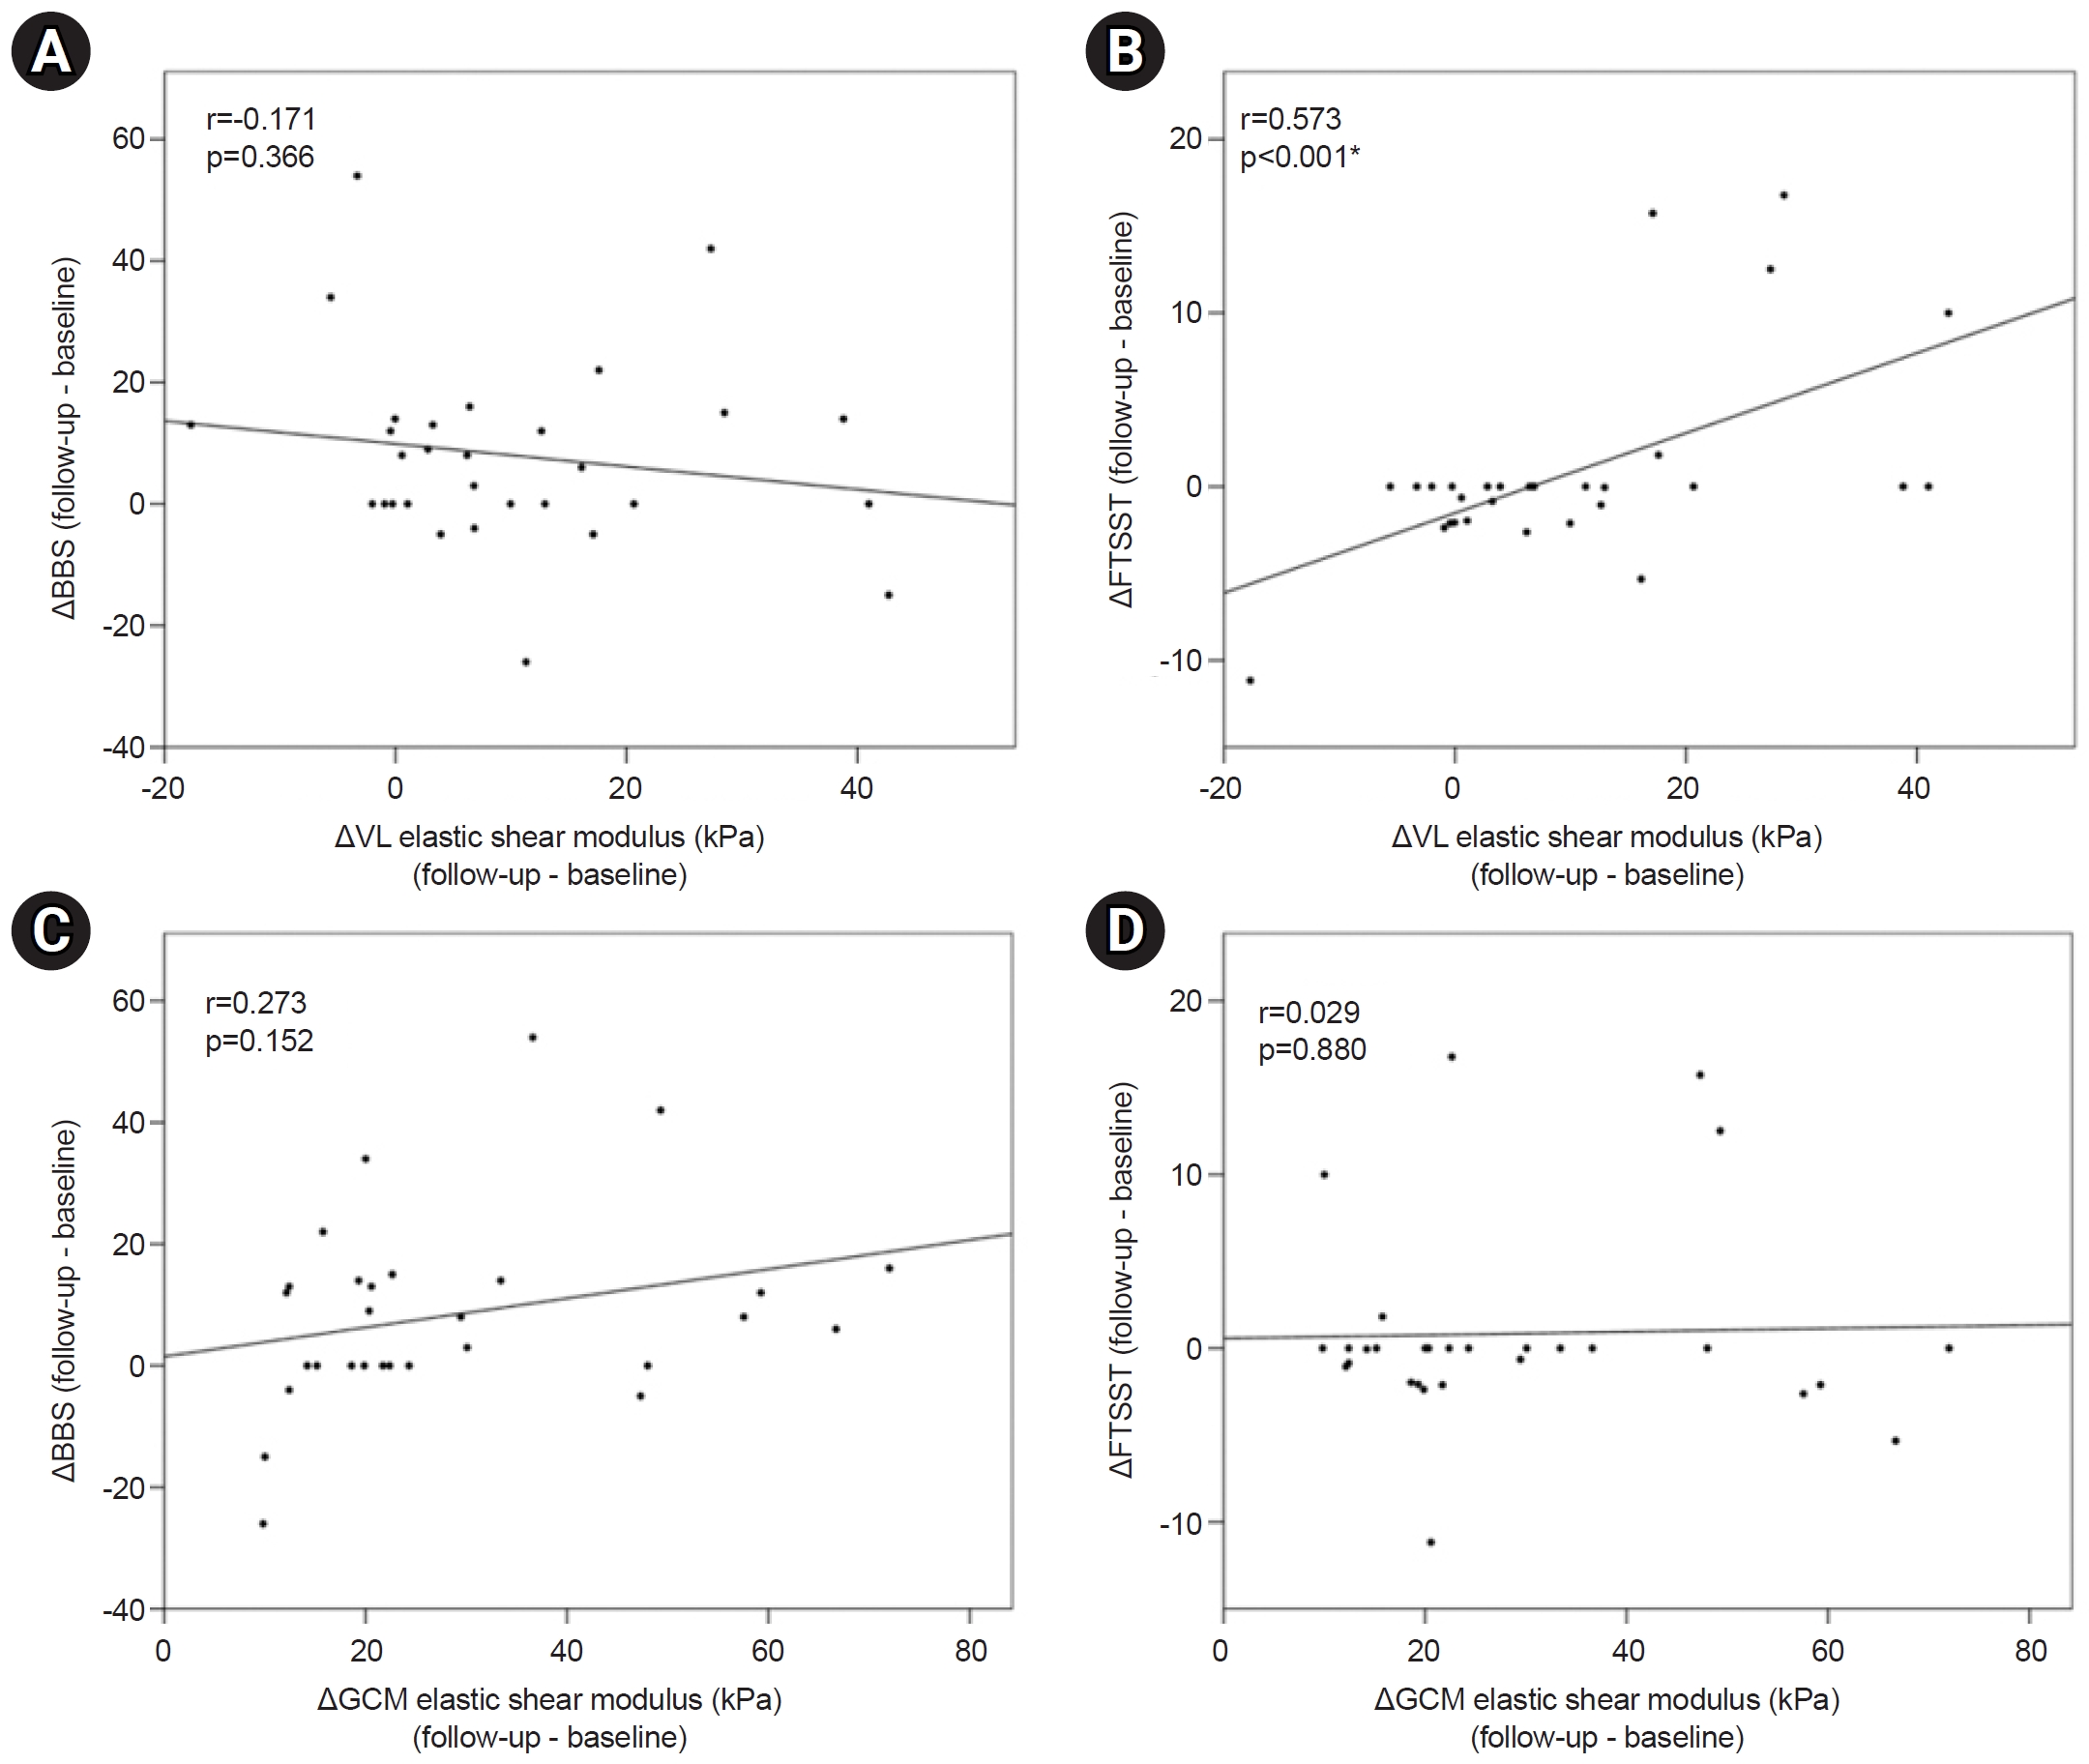
Relationships between changes in lower limb function and changes in muscle elastic shear modulus. (A, B) vastus lateralis (VL). (C, D) gastrocnemius (GCM). BBS, Berg Balance Scale; FTSST, Five Times Sit to Stand Test. *p<0.05.
DISCUSSION
The main findings of this study are that, while the muscle quantity did not significantly change at the time of subacute stroke, the muscle quality showed changes in the paretic VL and GCM muscles. As the elastic shear modulus of VL was high, the lower limb function was low in cross-sectional comparison. In addition, the more elastic shear modulus of the VL changed, the less the improvement in lower extremity function evaluated by the FTSST.
Previous studies have shown that the SWV of the paretic biceps brachii was higher compared to that of the non-paretic side in stroke survivors [17,19,21,22]. The SWV of the GCM muscle was also shown to be higher on the paretic side compared to that on the non-paretic side [15,23]. However, these studies were cross-sectional studies on patients in the chronic stroke stage. In one study conducted for post-acute stage (poststroke duration 8.4±7.6 weeks), SWV of the biceps brachii muscle was higher on the paretic side than that on the non-paretic side [24]. To the best of our knowledge, no study has analyzed the longitudinal muscle quality changes of lower extremity muscles in subacute stroke patients. Thus, this study has revealed that the elastic shear modulus of the paretic VL and GCM muscles increased according to time during the subacute stage in stroke patients.
Changes in muscle material properties are identified secondary to neurological injury like stroke [25]. According to muscle biopsy studies, stiff muscles are associated with the increase in the collagen and proteins that constitute the extracellular matrix [26]. Attempts have been made to quantify the alterations of the structure and mechanical properties of skeletal muscles using ultrasound. Various other studies reported an increase in SWV on the paretic upper limb muscle due to muscle stiffness in stroke patients [17,21,24]. The present study also found an increase in elastic shear modulus in the subacute stage. These changes in muscle quality are predicted to be influenced by the subacute onset muscle stiffness through changes in muscle properties.
The results of this study indicated significant interval changes only in the VL and GCM on the paretic side among various lower extremity muscles. In a previous study, the GCM showed a greater difference in SWV between the paretic and non-paretic sides compared to the TA [15]. In another study comparing stroke patients with healthy individuals, the SWV increased in the GCM and soleus muscles [27]. This is presumed to be because the physical adaptation of muscles against neurologic impairment is specific for variable factors as architectural change, anatomical attachment, and fiber type distribution in each muscle [15]. In this study, a similar significant change was found for the elastic shear modulus of GCM, which coincided with that in previous studies. EI is an assessment of muscle quality by quantifying the intramuscular fat and fibrous tissues in the muscles using ultrasound. Meanwhile, in previous study, the EI increased in the paretic VL among the lower extremity muscles at 2-year follow-up of stroke survivors [8]. In a study comparing stroke patients with healthy controls, the EI was higher in the paretic VI, VL, VM, and TA [6]. These findings implied the changes in muscle properties of the quadriceps, which agreed with the increase in elastic shear modulus in VL in this study.
In a study of patients with acute and subacute stroke, it was reported that there was no change in muscle mass measured by two whole-body dual-energy X-ray absorptiometry 6 months after stroke onset [28]. Also, there was no significant change in lean mass in the longitudinal study 1 year after stroke [29]. In a study on chronic stroke patients (1.31 years on average), the lean tissue mass was shown to be significantly lower on the paretic side [30]. In two follow-up studies on chronic stroke patients, the quadriceps muscles showed an increase in EI and a decrease in MT [8,9]. In this study, there were no significant changes in the body composition, thigh and CCs, and MT on the paretic side according to time. Meanwhile, this study showed a significant increase in elastic shear modulus Thus, for subacute stroke patients, analysis of quality rather than muscle mass is more meaningful approach.
In a study analyzing the correlations between muscle properties and functions in patients, the upper limb functions decreased as the difference in the SWV of the biceps brachii between the paretic and non-paretic sides increased [17]. The upper limb functions assessed by the stroke rehabilitation assessment of movement decreased as the SWV of biceps brachii on the paretic side increased [24]. However, the relationship between lower limb functions and muscle quality remains unclear. The results of this study indicated a significant negative correlation between lower limb functions and the elastic shear modulus of the paretic VL in a cross-sectional analysis. And there was significant correlation between variation of FTSST and the variation of the elastic shear modulus in VL. An analysis between BBS and elastic shear modulus of VL showed cross-sectional correlation at baseline and follow-up, but the longitudinal change was not significant. It is presumed that various factors such as a small number of participants or a short follow-up period could have limited the results. Nevertheless, these cross-sectional and limited longitudinal correlation suggest that the lower limb functions were reduced as the muscle quality on the paretic VL decreased.
There are several limitations to this study. First, the number of participants was small. The FTSST and 10MWT in functional evaluation could only be tested on a small set of patients (n=13). In the future, the correlations should be analyzed for a larger number of participants. Second, all patients during admission received a conventional rehabilitation treatment (twice a day and 30 minutes per session) so that the natural course of the muscle quality in patients without rehabilitation treatment could not be examined. Third, although the rater was blinded to the site on the paretic side of the patient and diagnosis during measurements, the blinding was not complete as assumptions could be made based on appearance and gait.
In conclusion, the mechanical changes of lower extremity muscles in subacute stroke patients that cannot be evaluated independently by clinical assessments were longitudinally assessed non-invasively. In the subacute stage, the VL and GCM muscle quality on the paretic side exhibited interval changes with a directionality towards increased stiffness. In addition, the stiffness of the paretic VL showed a correlation with lower limb functions within a limited range. To conclude, the lower extremity in subacute stroke patients requires an approach to muscle quality rather than quantity.
Notes
CONFLICTS OF INTEREST
No potential conflict of interest relevant to this article was reported.
FUNDING INFORMATION
None.
AUTHOR CONTRIBUTION
Conceptualization: Cho ES, Kim DH. Methodology: Cho ES, Kim DH. Formal analysis: Kim JY, Lee JH. Project administration: Kim DH. Visualization: Cho ES. Writing – original draft: Kim DH. Writing – review and editing: Cho ES, Park YS, Chang HJ, Park JG. Approval of final manuscript: all authors