Diagnostic Accuracy of Harris Imprint Index, Chippaux-Smirak Index, Staheli Index Compared With Talar-First Metatarsal Angle for Screening Arch of Foot
Article information

Abstract
Objective
To determine the diagnostic accuracy and reliability of the Harris imprint index (HII), Chippaux-Smirak index (CSI), and Staheli index (SI) compared with the talar-first metatarsal angle.
Methods
Data was reviewed from the medical record at the orthotic and prosthetic clinic, Thammasat University Hospital from January 1, 2016 to August 31, 2020. The three footprints were measured by the rehabilitation physician and the orthotist. The talar-first metatarsal angle was measured by the foot and ankle orthopaedist.
Results
The data from 198 patients with 274 feet was analyzed. The diagnostic accuracy of the footprint triad showed that CSI was the most accurate in pes planus prediction, followed by HII and SI (area under the receiver operating characteristic curve [AUROC]=0.73, 0.68, 0.68, respectively). In pes cavus, HII was the most accurate, followed by SI and CSI (AUROC=0.71, 0.61, 0.60, respectively). For pes planus, the intra-observer reliability by Cohen’s Kappa was 0.92 for HII, 0.97 for CSI, and 0.93 for SI, the inter-observer reliability 0.82, 0.85, and 0.70, respectively. For pes cavus, the intra-observer reliability was 0.89 for HII, 0.95 for CSI, and 0.79 for SI, inter-observer reliability of 0.76, 0.77, and 0.66, respectively.
Conclusion
The accuracy of HII, CSI, and SI was fair in screening of pes planus and pes cavus. The intra- and inter-observer reliability were in the moderate to almost perfect range by Cohen’s Kappa.

INTRODUCTION
Pes planus (flatfoot) and pes cavus (high-arched foot) are types of foot deformity that may cause foot or ankle injury [1]. Patients with pes planus have a collapse of the medial longitudinal arch, foot abduction at the talonavicular joint, and hindfoot valgus. By contrast, patients with pes cavus have a midfoot cavus, prominence of lateral midfoot, forefoot adduction, and hindfoot varus. Patient symptoms include foot or ankle pain, foot or ankle deformity, gait instability, and frequent falling etc [2,3].
Pes planus and pes cavus are usually diagnosed by physical examination, radiographic evaluation, and footprint measurement by individual physicians. The physical examinations include a medial longitudinal arch height measurement, foot-ankle alignment especially forefoot abduction angle and heel angle measurements [1,4,5]. The radiographic evaluation includes measurements of lateral talar-first metatarsal angle, a talocalcaneal angle, a calcaneal pitch, and a metatarsus adduction angle [4-6]. Among these, a lateral talar-first metatarsal angle defined by Meary, is the most widely used for pes planus and pes cavus evaluation using a weight-bearing lateral radiograph [7]. The talar-first metatarsal angle is highly sensitive and specific to describe the arch of the foot [4,8]. However, radiographic measurement needs an experienced physician for interpretation.
Footprint measurement can include the Harris imprint index (HII), Chippaux-Smirak index (CSI), Staheli index (SI), Clarke’s angle, footprint index, arch index, arch length index, and truncated arch index. The HII, CSI, and SI measure a distance or calculate a distance ratio by using a simple measuring instrument such as a vernier caliper [5,9-11].
In the orthotic and prosthetic clinic, rehabilitation department, Thammasat University Hospital, the rehabilitation physician and the orthotist usually use physical examination and the footprint measurement to diagnose pes planus and pes cavus. The footprint measurements for HII, CSI, and SI are frequently performed in our clinic because of ease-of-use, rapidity, low cost and low tech in terms of instruments [12]. Furthermore, the footprint shows not only a foot shape but also reveals a high-pressure area of the foot that is useful in making a customized foot orthosis. However, a foot shape determined from the footprint measurement sometimes dose not relate with the patient’s symptoms or radiographic evaluation. Therefore, this study aims to determine the diagnostic accuracy and reliability of the footprint measurements expressed as HII, CSI, and SI compared with the radiographic measurement of the talar-first metatarsal angle for screening the arch of the foot.
METHODS
This retrospective study was approved by the Human Research Ethics Committee of Thammasat University (Medicine) (approval number: MTU-EC-RM-2-205/63), on October 17, 2020 and registered in the Thai Clinical Trials Registry (TCTR 20220919003).
Participants
Patients were referred to the orthotic and prosthetic clinic, rehabilitation department, Thammasat University Hospital between January 1, 2016 and August 31, 2020. Data was collected from the medical record. Inclusion criteria were (1) age between 18–80 years and (2) the footprint measurement and the radiographic evaluation in lateral foot weight-bearing position were recorded. Patients with history of fracture and/or surgery in ankle and foot were excluded.
Data from all patients who had undergone the footprint measurement and the radiographic evaluation in lateral foot weight-bearing position was recruited and dedicated to this study.
Test methods
The reference method used the talar-first metatarsal angle in lateral foot weight-bearing radiograph. This angle has been used to identify the foot deformity in patients with pes planus and pes cavus. The talar-first metatarsal angle is formed between a line drawn along the longitudinal axis of the talus and the first metatarsal bone (Fig. 1A). The arch of foot is classified as pes cavus when convex upward angle >4 degrees, a normal arched foot has convex upward to downward angle within 4 degrees, and pes planus has convex downward angle >4 degrees [7,13]. The talar-first metatarsal angle compared with symptoms of the patient shows sensitivity and specificity of 88% and 94% respectively in pes cavus, and 100% and 87% respectively in pes planus [14]. This angle has a good intra-observer reliability (intraclass correlation coefficient [ICC]=0.96) and inter-observer reliability (ICC=0.69) [8]. The talar-first metatarsal angle in radiograph was measured at a single time using a goniometer by the one experienced foot and ankle orthopaedist who blinded for the clinical diagnosis.
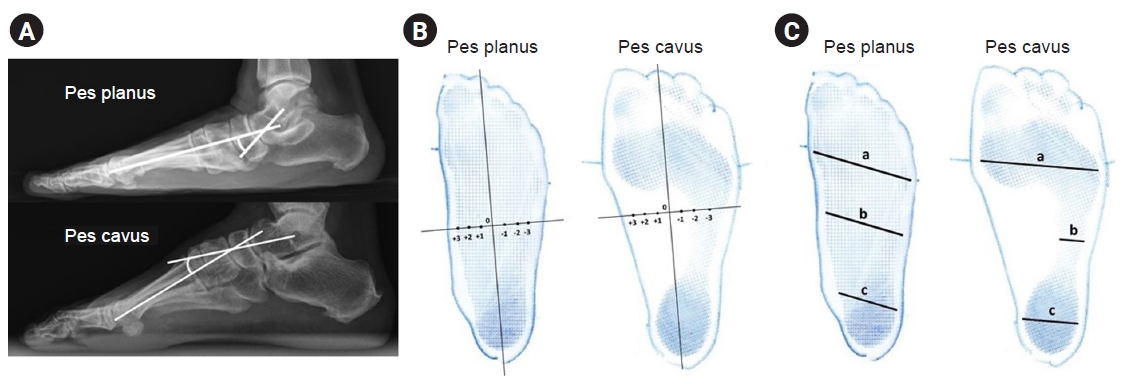
Talar-first metatarsal angle (A), Harris imprint index (B), Chippaux-Smirak index (b/a×100), and Staheli index (b/c) (C).
The footprints were performed by the Harris mat footprint method and documented in the medical record. The 3 index tests of HII, CSI, and SI were conducted with computer-assisted program. (1) The HII measured a distance from the origin of two perpendicular lines in centimeter. The y-axis is a midline foot axis from tip of 2nd toe to the midpoint of hindfoot and the x-axis is a perpendicular line drawn medially and laterally at the widest and narrowest point of the arch (Fig. 1B). HII score is based on distance from the origin of the x-axis where the lateral side of arch is negative and medial side of arch is positive. HII score defined as pes cavus is (-4, -3, -2), normal arched foot is (-1, 0, +1), and pes planus is (+2, +3, +4) [5,9]. (2) The CSI is the ratio between the narrowest width of the midfoot (line b) to the widest width of the forefoot (line a) (CSI=b/a×100; Fig. 1C). CSI≤24% is classified as pes cavus, 25% to 45% as normal arched foot and ≥46% as pes planus [9]. (3) The SI is the ratio between the narrowest width of the midfoot (line b) to the widest width of the hindfoot (line c) (SI=b/c; Fig. 1C). SI≤0.4 is categorized as pes cavus, 0.5–0.7 normal arched foot and ≥0.8 as pes planus [9,15]. All 3 index tests were measured two times with an interval of 2 weeks to determine the intra-observer reliability by the rehabilitation physician. Furthermore, the orthotist who blinded to the results of the other tests measured the index tests at one time to calculate the inter-observer reliability.
Statistical methods
Categorical data is presented as frequency and percentages. Continuous data is presented as mean, median, standard deviation, and minimal-maximal values dependent on nature of data. The sensitivity, specificity, likelihood ratio of a positive test and a negative test (LR+, LR-), positive and negative predictive values (PPV, NPV), and the area under the receiver operating characteristic curve (AUROC) with 95% confidence interval (95% CI) of the index tests were calculated by 2×2 table. The intra-observer and inter-observer reliability were determined by Cohen’s Kappa [16]. The data was analyzed via STATA version 15.1 (Stata, College Station, TX, USA).
RESULTS
One hundred and ninety-eight patients with 274 feet were included. The average age was 60.7±14.5 years. Female and male were 79.3% and 20.7% (Table 1). Foot type classified by radiographic evaluation and footprint measurements were divided into pes planus, normal arched foot, and pes cavus (Fig. 2).
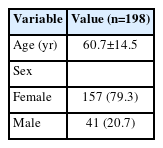
Demographic data of patients
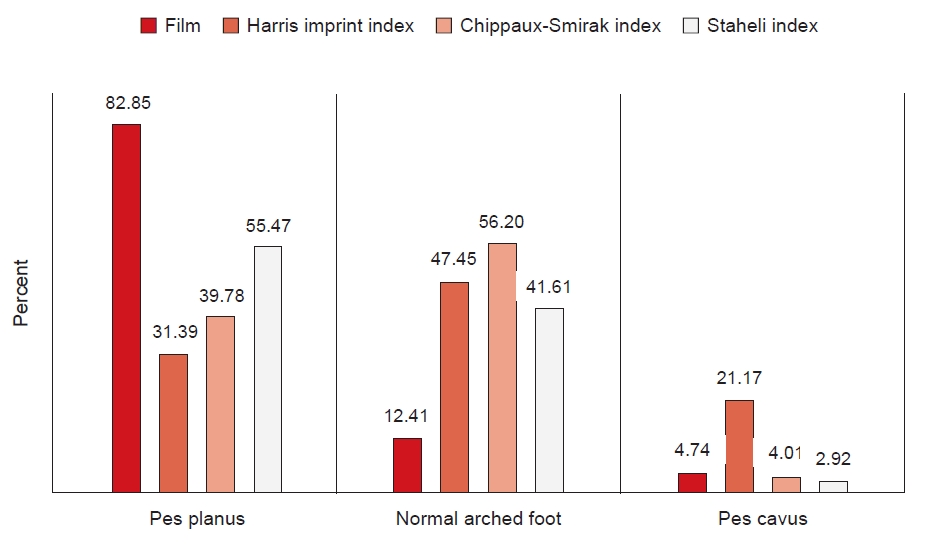
Foot type classified by radiographic evaluation and footprint measurement (%).
The diagnostic accuracy of HII, CSI, and SI compared to talar-first metatarsal angle for pes planus diagnosis is shown in Table 2. The frequency of pes planus was 82.8%. Table 3 shows the diagnostic accuracy of HII, CSI, and SI compared to talar-first metatarsal angle for pes cavus diagnosis. The frequency of pes cavus was 4.7%.
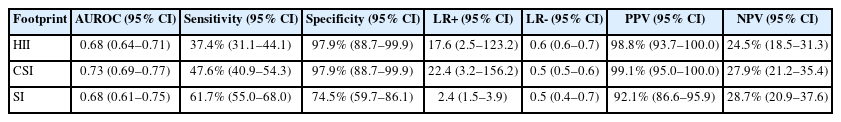
The diagnostic accuracy of HII, CSI, and SI for pes planus

The diagnostic accuracy of HII, CSI, and SI for pes cavus
In pes planus, the intra-observer reliability of HII, CSI, and SI shown by Cohen’s Kappa were 0.92, 0.97, and 0.93, respectively. In addition, the inter-observer reliability of HII, CSI, and SI were 0.82, 0.85, and 0.70, respectively. In pes cavus, the intra-observer reliability of HII, CSI, and SI shown by Cohen’s Kappa were 0.89, 0.95, and 0.79, respectively, and the inter-observer reliability of HII, CSI, and SI were 0.76, 0.77, and 0.66, respectively (Table 4).
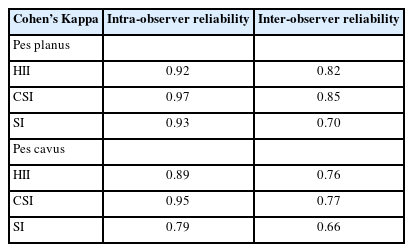
Intra-observer reliability and inter-observer reliability
DISCUSSION
The diagnostic accuracy of the footprint showed that CSI was the most accurate in pes planus prediction, followed by HII and SI (AUROC=0.73, 0.68, 0.68, respectively). In pes cavus prediction, HII was the most accurate, followed by SI and CSI (AUROC=0.71, 0.61, 0.60, respectively). For pes planus, the intra-observer reliability was almost perfect by Cohen’s Kappa (HII=0.92, CSI=0.97, SI=0.93) and the inter-observer reliability was moderate to strong (HII=0.82, CSI=0.85, SI=0.70). For pes cavus, the intra-observer reliability was moderate to almost perfect (HII=0.89, CSI=0.95, SI=0.79) and the inter-observer reliability was moderate (HII=0.76, CSI=0.77, SI=0.66).
The diagnostic accuracy of HII shows an overall useful test by AUROC (0.68 in pes planus and 0.71 in pes cavus). HII displayed low sensitivity but high specificity in diagnosis of both pes planus and pes cavus. Previous research showed HII has a medium correlation with the talar-first metatarsal angle (r=0.485) and heel valgus (r=0.462) in pes planus [5]. The vulnerabilities that might affect the diagnostic accuracy of HII are, firstly, a y-axis is usually drawn from tip of 2nd toe to the midpoint of hind foot. If a patient had varus or valgus of 2nd toe, it might change the position of the y-axis. Then the HII distance from the center to the narrowest or widest of arch is changed. Secondly, forefoot deformity hallux valgus with 2nd toe overriding, or claw toe might cause a 2nd toe float which would not be imprinted on the Harris mat. Therefore, a tip of 2nd toe could not be exactly aligned as y-axis of HII. The HII revealed (1) almost perfect intra-observer reliability and strong inter-observer reliability in pes planus, and (2) strong intra-observer reliability and moderate inter-observer reliability in pes cavus. The rehabilitation physician and the orthotist returned differing measurements of the hollowed arch, and that may be the reason for moderate inter-observer reliability.
The diagnostic accuracy of CSI showed an overall useful test by AUROC (0.73 in pes planus and 0.60 in pes cavus). The CSI displayed low sensitivity but high specificity in diagnosis both pes planus and pes cavus. Previous research found CSI compared with pes planus symptoms showed high sensitivity (94.2%) but low specificity (56.1%) [6], confirming that correlation between CSI and pes planus condition was high (r=-0.663) [4]. In addition, CSI was influenced by obesity and calcaneal alignment [17,18]. CSI measures the ratio of the narrowest width of the midfoot to the widest width of the forefoot. The prominence of lateral midfoot in pes cavus may increase the narrowest width of the midfoot distance to the point that CSI might not be in a pes cavus range [2]. This CSI revealed (1) almost perfect intra-observer reliability and strong inter-observer reliability in pes planus, and (2) almost perfect intra-observer reliability and moderate inter-observer reliability in pes cavus. Previous work in pes planus revealed excellent intra-observer and inter-observer reliability by ICC (>0.9) [19,20]. Measurement of the narrowest width of the midfoot point returned unequal distances between rehabilitation physician and orthotist which may possibly have caused moderate inter-observer reliability.
The diagnostic accuracy of SI shows an overall useful test by AUROC (0.68 in pes planus and 0.61 in pes cavus). The sensitivity (61.7%) and specificity (74.5%) of SI for pes planus (cut point≥0.8) are close to that of Plumarom et al. [21] (sensitivity=70.2%, specificity=73%, cut point≥0.77). Nevertheless, the work of Pita-Fernández et al. [6] showed high sensitivity (81.8%) but low specificity (58.7%) in relation to pes planus symptom, probably because the correlation between SI and pes planus symptom was high (r=-0.662) [4]. Overweightness and excessive foot soft tissue may likely cause a false positive pes planus symptom [21]. In contrast, this study shows SI in pes cavus to have low sensitivity but high specificity. SI measures the ratio of the narrowest width of the midfoot to the widest width of the hindfoot. The prominence of lateral midfoot in pes cavus may increase the narrowest width of the midfoot distance to the point that SI might not be in pes cavus range in a similar way to CSI [2]. This SI reveals (1) almost perfect intra-observer reliability and moderate inter-observer reliability in pes planus, and (2) moderate intra-observer reliability and inter-observer reliability in pes cavus. The previous studies in pes planus revealed excellent intra-observer and inter-observer reliability (ICC>0.9) [19,20]. The rehabilitation physician and orthotist returned unequal measurements of the narrowest width of the midfoot which may possibly have caused moderate inter-observer reliability.
There are several limitations to this study. First, this study was a retrospective study in which the prevalence of pes planus and pes cavus were unequal. Second, some patients were excluded because the footprint or radiographic evaluation were not done. Future studies will be designed in a prospective study and will attempt to recruit every patient passing through the clinic.
In conclusion, the accuracy of the HII, CSI, and SI was fair in screening of pes planus and pes cavus. The intra- and inter-observer reliability of the three footprints were in the moderate to almost perfect range by Cohen’s Kappa.
Notes
No potential conflict of interest relevant to this article was reported.
Acknowledgements
This work was supported by Faculty of Medicine, Thammasat University, Thailand (grant number: 1-02-2564).
Notes
Conceptualization: Paecharoen S. Methodology: Paecharoen S, Arunakul M, Tantivangphaisal N. Formal analysis: Paecharoen S. Funding acquisition: Paecharoen S, Arunakul M, Tantivangphaisal N. Project administration: Paecharoen S. Visualization: Paecharoen S. Writing – original draft: Paecharoen S. Writing – review and editing: Paecharoen S, Arunakul M. Approval of final manuscript: all authors.