Cephalic Index of Korean Children With Normal Brain Development During the First 7 Years of Life Based on Computed Tomography
Article information

Abstract
Objective
To identify the normal range, distribution, and age-dependent differences in the cephalic index (CI) of Korean children with normal brain development and develop a classification of the current CI for Korean children up to 7 years of age.
Methods
We retrospectively analyzed 1,389 children who visited our hospital in the emergency room between October 2015 and September 2020 because of suspected head injuries. Finally, 1,248 children (741 male and 507 female) were enrolled after excluding abnormal medical or familial history and divided into 10 groups by age. The CI was measured using brain computed tomography and calculated according to the following equation: cephalic width/cephalic length×100.
Results
The averages of CI by age groups were as follows: 89.29 (0–3 months group, n=44); 91.41 (4–6 months group, n=63); 89.68 (7–9 months group, n=62); 87.52 (10–12 months group, n=41); 87.64 (≥2 years group, n=243); 86.63 (≥3 years group, n=178); 85.62 (≥4 years group, n=232); 85.77 (≥5 years group, n=201); 85.15 (≥6 years group, n=75); and 85.34 (≥7 years group, n=109). The CI of Korean children in normal brain development was confirmed to be large, showing a notable difference compared to that of Caucasians.
Conclusion
The current CI of Korean children will provide a valuable reference for diagnosing and treating cranial deformities, especially dolichocephaly and brachycephaly as well as to monitor the morphology of the cranium in clinics.
INTRODUCTION
Depending on the skull shape, cranial deformities can be divided into plagiocephaly, dolichocephaly, and brachycephaly [1]. Plagiocephaly is correctly applied to describe only flattening on one side of the head. Brachycephaly denotes parietal widening, such as symmetrical occipital flattening, and dolichocephaly is a condition in which the anterior and posterior cranium are expanded by flattening of the side of the head [2].
The cephalic index (CI) is a useful tool to assess cranial morphology of all types of cranial deformities in clinical settings. It is easy to measure and has high repeatability [3,4]. The CI is an indicator that can be used to check dolichocephaly, which is the most common form of the craniosynostotic deformity, and brachycephaly, which is frequently generated by positional cause [3,5]. Cohen’s classification, which is the most widely used tool to categorize cranial shapes in the research field, is also based on the CI range [6]. In clinical settings, the CI is a valuable reference to set standards for the application of cranial-molding orthoses (helmet) [1]. It is also used when making preoperative plans and evaluating postoperative outcomes of cranial deformities for neurosurgery and plastic surgery [3,7].
The concept of CI was first used by a Swedish anatomist Anders Retzius (1796–1860) as a ratio of width to length in any skull [8]. The width is defined as the distance between both sides of the head at the most protruding point above and behind the ears. The length is the distance from the glabella and the most protruding point at the back of the head [9]. The original technique to measure the CI was a manual measurement using a caliper; however, various imaging techniques, such as skull radiography, two-dimensional computed tomography (2DCT), 3DCT, 3D photo, and plagiocephalometry can be used instead of manual physical examination [3]. In clinical settings, manual measurements are widely used, considering cost-effectiveness or safety. CT is also an excellent method in terms of accuracy and reproducibility, but it is difficult to be checked repeatedly because of the cost and radiation [10].
The CI and head shape are greatly affected by sex, age, and racial factors. Graham et al. [11] conducted a key study on cultural factors affecting the skull shape. He insisted that the cultural factor of supine-sleeping can affect the CI; therefore, the people of India, Korea, Japan, and Pakistan who have a tendency for supine-sleeping had a large CI, and the people of Nigeria, United States, Canada, Hawaii, and Europe who have prone-sleeping had a small CI.
There are several reports measuring CI in children with normal development. However, studies have been conducted mostly in Caucasians [12,13]. For the Asian population, only a few reports have been presented on Japanese and Chinese children [14,15]. Available researches on the Korean population covered the CI data of the 1980s and the included population was small [16,17]. Until now, for the updated reference of CI, clinicians in Korea adjusted the CI standard based on foreign data. Knowing that the CI varies between races, clinicians referred to the CI range of Japanese or Chinese people who were supposed to have similarity to Koreans other than Caucasians. However, whether Asian data can be applied directly to Koreans remains unclear. Considering reports that the standards of the CI may change over time, it is not reasonable to apply the previously reported normal range to the current clinical decision-making, and updated CI data of Korean children are needed [14]. Therefore, the primary aim of this study was to identify the normal range, distribution, and age-dependent differences in the CI of Korean children with normal brain development.
MATERIALS AND METHODS
Patients
Medical records of 1,389 children (786 male and 603 female) were reviewed. They visited the emergency center of Inje University Busan Paik Hospital from October 2015 to September 2020 with minor trauma and suspected head injuries.
Inclusion criteria for the study were as follows: (1) brain CT performed for suspected head trauma and diagnosed normal and (2) age ≤7 years. The exclusion criteria were as follows: (1) prematurely born children; (2) known chromosomal abnormality or inherited condition, even if no anatomical abnormality was seen; (3) any developmental delay; (4) diagnosis of any craniofacial syndrome or significant craniofacial abnormality; (5) any anatomical abnormality; (6) hydrocephalus; and (7) the subject’s parents were not Korean.
The enrolled children were divided into 10 groups by age: 0–3 months, 4–6 months, 7–9 months, 10–12 months, ≥2 years of age (13–24 months), ≥3 years of age (25–36 months), ≥4 years of age (37–48 months), ≥5 years of age (49–60 months), ≥6 years of age (61–72 months), and ≥7 years of age (73–84 months). The present study was approved by the Institutional Review Board of Inje University Busan Paik Hospital (No. 2020-10-012). The informed consent was waived.
Measurement and procedure
Analyzed images were obtained by a high-resolution CT scan using a Discovery 750 HD CT scanner (GE Healthcare, Waukesha, WI, USA) with the application of 0.5 mm width of scan slices (layers) to obtain an axial view applying the standard diagnostic protocol for head examination. The CT images were analyzed through Maroview 5.4 (Infinitt Inc., Seoul, Korea) by two physicians with >2 years of professional experience as an evaluator. Each scan was measured based on reliable bony landmarks selected to assess the cranial vault, as described by Waitzman et al. [13]. The CI was calculated according to the following equation: cephalic width/cephalic length×100 (Fig. 1).

Cephalic index measurement by computed tomography scan: “a” cephalic length and “b” cephalic width. Cephalic index = b/a×100.
Comparison of the CI changes between races
Based on the data obtained, the average CI for each age group was calculated. For comparison with other populations, previously reported CI data of Caucasian, Polish, and Japanese populations were reviewed [12-14].
Proposal of Korean CI classification
Following the classification method of Koizumi et al. [14], we classified the CI using the obtained data and defined the mean value of CI ±1 standard deviation (SD) as mesocephaly, ≤-1 SD as dolichocephaly, +1 to 2 SD as brachycephaly, and ≥2 SD as hyperbrachycephaly. For severity estimation, the study of Wilbrand et al. [18] using percentile distribution was referred to. Dolichocephaly was classified as mild (CI, 10–25 percentile), moderate (3– 10 percentile), and severe (<3 percentile). Brachycephaly was classified as mild (CI, 75–90 percentile), moderate (90–97 percentile), and severe (>97 percentile).
Statistical analysis
All data manipulations and statistical analyses were performed using the statistical software SPSS version 25.0 (IBM SPSS, Armonk, NY, USA), and the level of statistical significance was set at p<0.05. For baseline characteristics, all data were expressed as mean±SD. The data were analyzed by independent Student t-test.
RESULTS
Brain CT scans of a total of 1,389 children were reviewed. Among them, 141 children (10.2%) were excluded according to the exclusion criteria: 68 were born prematurely, 36 had seizure history, 11 had developmental delay, 9 had chromosomal abnormalities (such as DiGeorge syndrome and Down syndrome), 6 had hydrocephalus, 2 had autism, 2 had growth hormone deficiency, 1 had macrocephaly, 1 had brain tumor, 1 had a history of past surgery with craniosynostosis, 1 had Sturge-Weber syndrome, 1 had Dandy-Walker syndrome, 1 had congenital ventriculomegaly, and 1 child had foreign parents. A total of 1,248 children (741 male and 507 female) were recruited, and the sex distribution by age group is displayed in Table 1.
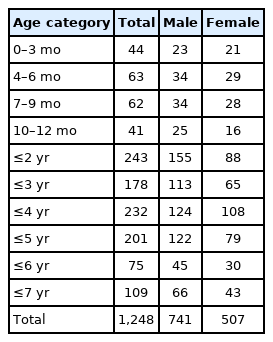
Age and sex distribution of study population
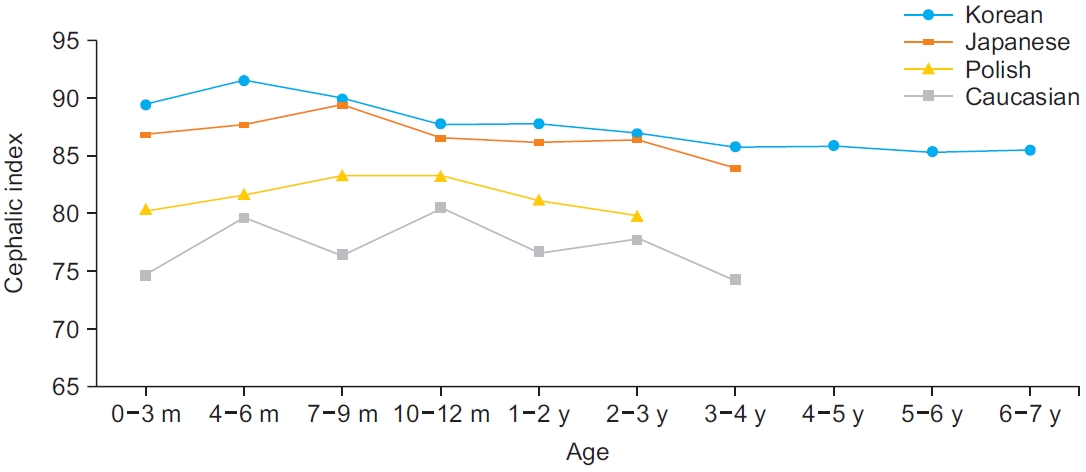
The mean and SD of the CI for each age group are shown in Table 2. The overall mean CI was 86.82±6.66. The mean CI for males was 86.80±6.32, and that for females was 86.84±7.13. There was no significant difference between the male and female CI for all age groups. The Korean averages of the CI were larger than those of other populations in all age groups and were relatively similar to those of the Japanese (Fig. 2). According to Cohen’s classification, more than 50% of Korean children were classified as having hyperbrachycephaly, with the exception of children between 3 and 6 years of age (Fig. 3).

Cephalic index of Korean children with normal brain development
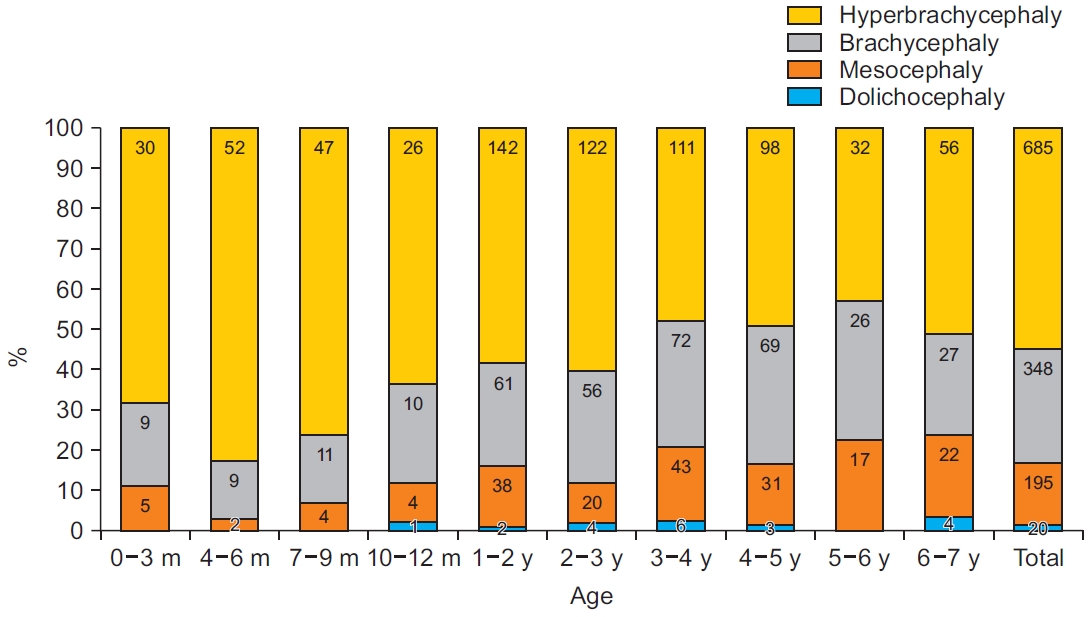
The cranial morphology of Korean children, according to Cohen’s classification. Values are presented as the number of children.
Based on the Korean data obtained in these results, the modified CI range for current Korean children was categorized (Table 3). The modified ranges of the current CI of Korean children are as follows: dolichocephaly (n=108), 80.1 or less (≤-1 SD); mesocephaly (n=432), 80.2–93.4 (±1 SD); brachycephaly (n=93), 93.5–100.0 (+1 to 2 SD); and hyperbrachycephaly (n=17), 100.1 or higher (≥2 SD) (Table 3, Fig. 4). Furthermore, another proposal for severity of cranial deformity in Korean children using percentile distribution is displayed in Table 4. Dolichocephaly was classified as mild (79.6–82.4), moderate (77.3–79.5), and severe (77.2 or less). Brachycephaly was classified as mild (90.1–94.0), moderate (94.1–98.5), and severe (98.6 or higher).

Cohen’s classification and proposal of Korean cephalic index classification
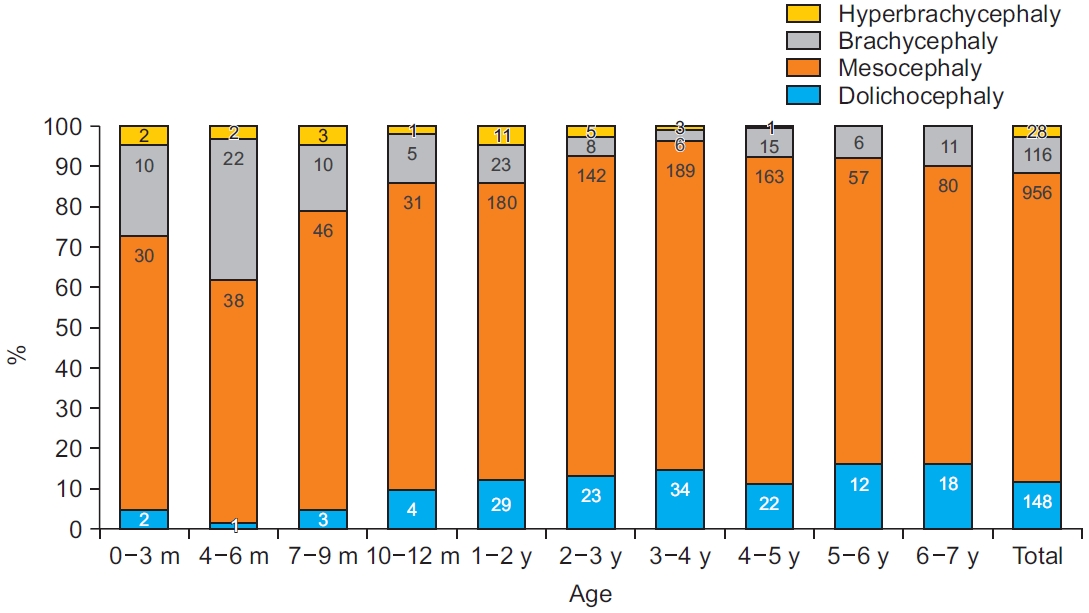
The cranial morphology of Korean children, according to standard deviation. Dolichocephaly (≤-1 standard deviation [SD]), mesocephaly (±1SD), brachycephaly (+1 to 2 SD), and hyperbrachycephaly (≥2 SD). Values are presented as the number of children.

Classification of cephalic index of Korean children with percentile distribution
DISCUSSION
This study showed that the CI of Korean children is larger than that of other races, and the difference with the CI of Caucasians is significant. The cranial shapes of most Korean children were categorized as brachycephalic or hyperbrachycephalic, as estimated by Cohen’s classification. We presented a proposal for Korean clinical CI classification using SD and the ranges of Korean CI that showed large differences from Cohen’s classification.
The differences in the CI among races were clearly defined by comparison with several previous studies (Fig. 2). The mean CI values for Korean children in each age group display notable differences in all ages. In 1992, Waitzman et al. [13] reported the normal values of the CI of normal brain developed Caucasian children, which was a study including children of ages 0–4, with an average CI of 77.3. Compared to our average of 87.39 in the same age range, Korean children showed a larger CI result than Caucasians. According to the study of Likus et al. [12] of 180 normal Polish children between the ages of 0 and 3 years in 2013, the average CI was 81.45±7.06, which is also smaller than that of Korean children aged 0–3 years observed in our study. The average CI of Korean children was 88.04, and the SD was 7.32 in the same age range in our study. In Polish children, the CI increased in the age between 7 and 12 months and decreased thereafter.
The difference in the CI was also noted among Asian populations, but the differences were definitely smaller than those compared to Caucasians. In 2010, Koizumi et al. [14] reported a study on the CI of 104 normal Japanese children aged 0–4 years. The average CI was 86.5 with an SD of 7.3, which is very similar to the average CI (87.39±7.07) of the Korean children observed in our study. Some differences were observed when comparing the data of each age group. Korean children showed a greater CI than Japanese children between 0 and 6 months of age. Korean children reached the peak CI between 4 and 6 months, while Japanese children had the peak CI at 7–9 months of age, which decreased thereafter (Fig. 2). Referring to the previously reported CI of 0–6 months of age, the average CI was 86.7, which was smaller than the 89.29 average for Korean children under 3 months of age and 91.41 average at 4–6 months of age [15]. However, the data cannot be compared directly with our data because the included Chinese population was premature.
Regarding Korean data [16], the CI in this study has few comparable studies. In 1986, one study reported that the average CI of Korean individuals was 84.61±4.45 for male participants (n=608) and 85.04±4.47 for female participants (n=242). However, it is not possible to analyze the change in Korean CI according to that study because the enrolled population included an adult population of 850 college students. Another study was conducted in Korea based on skull radiographs in 2011 [17]. The age of the enrolled population was 0–20 years, and it helped identify the trend of overall difference in CI. However, it is difficult for physicians to use that data for the practice of helmet treatment because of selection bias. The sample size of enrolled children between 0 and 7 years of age was small in the previous report. In particular, the groups under the age of 1 year, which is the target age of helmet prescription and has large changes in the skull, had only 48 males and 31 females. In addition, it is not clear whether several underlying conditions affecting growth, deformity, or deformation were excluded. The radiographic measurement method is not sufficiently proven to be valid compared to CT for the CI. Postural diversity of the cervical spine and the distance between the patient and the film can cause measurement errors. Due to the above possible limitations, there were differences in results from other reports. First, the primary increase and decrease in the CI reported in most other studies have not been identified. Second, the CI averages for male and female children under the age of 4 months had big differences. We were unable to estimate the normal range of the CI because it did not present the distribution of the CI data. Our study was conducted with consideration of previous studies, and included a large population and the most recent data to investigate the CI of children aged up to 7 years with normal brain development.
Head shapes are classified into four international categories, which include dolichocephaly, mesocephaly, brachycephaly, and hyperbrachycephaly. This classification was introduced in the Handbook of Physical Measurements [19] and Cohen [6], which reproduced the standard CI range for each category (Table 3). The CI ranges for each category were as follows: dolichocephaly up to 75.9, mesocephaly 76.8–80.9, and brachycephaly 81–85.4, with hyperbrachycephaly classified at CI exceeding 85.5. Adopting Cohen’s criteria directly to our data, a serious imbalance of distribution occurred. Among the 1,248 children, 20 were classified as dolichocephalic, 195 were mesocephalic, 348 were brachycephalic, and 685 were hyperbrachycephalic, which leads to the misunderstanding that more than 50% of Korean children are hyperbrachycephalic and candidates for treatment (Fig. 3). To avoid this bias, it is necessary to apply proper normal CI data of specific populations.
The proposal of the Korean CI range in this study was estimated based on SD. Among the Asian population, one study presented a new range of the CI for each head shape among Japanese children [14]. In that study, SD was used to classify dolichocephaly, mesocephaly, and brachycephaly as follows: dolichocephaly (≤-1 SD), mesocephaly (±1 SD), brachycephaly (+1 to 2 SD), and hyperbrachycephaly (≥2 SD). In addition, SD is a widely used criterion to analyze anthropometric data and it has been used in several other studies to determine the normal range of the CI in a specific population [20,21]. Another method of classification is to use percentile distribution to categorize the severity of dolichocephaly and brachycephaly [18,22]. Following previous studies, dolichocephaly is classified as mild (CI, 10–25 percentile), moderate (3–10 percentile), and severe (<3 percentile). Brachycephaly is classified as mild (CI, 75–90 percentile), moderate (90–97 percentile), and severe (>97 percentile).
For a more practical reference value to Korean clinics, we made two new references for the classification of the CI of Korean children using mean and SD or percentile distribution. According to our CI index, the skull shapes of Korean children were classified as follows: dolichocephaly (n=148), 80.1 or less (≤-1 SD); mesocephaly (n=956), 80.2–93.4 (±1 SD); brachycephaly (n=115), 93.5–100.0 (+1 to 2 SD); and hyperbrachycephaly (n=29), 100.1 or higher (≥2 SD) (Table 3). These criteria of the CI ranges are far different from international classifications; therefore, for practical procedures, it is recommended to use CI determined for each patient according to a particular age group. Another proposal for Korean classification using percentile distribution is displayed in Table 4. According to this classification, a more specific diagnosis and follow-up is possible because it contains the index for severity.
Previous studies enrolled children aged up to 3 or 4 years, as most cranial deformities usually occur in that age range. In this study, we widened the age range up to 7 years to observe how CI changes until the brain growth is complete. In our data, the peak CI was observed at 4–6 months, and a steady decline was observed at 3–4 years. Thereafter, little change was noted up to 7 years of age. Further study in a large Korean population is needed to identify whether the CI of children aged 7 years is similar to that observed in adults.
This study has several limitations. First, as a retrospective study, the sex ratio of males to females was not controlled, and the number of children under the age of 1 was smaller than that of other age groups as they were divided into four groups by months. Second, this study is limited to one medical institution, and even though it covers a metro city, it does not represent the overall population of Korea. A nationwide multicenter study is needed to provide diagnostic criteria for higher reliability. Third, CT scans are not always available in clinical practice, and data manually measured by calipers may not be applicable to our data. However, this bias can be ignored on the basis of a previous study that reported no statistically significant difference between caliper-based measurement and CT-based measurement of the CI [23]. Fourth, the inter- and intra-rater reliability of CI measurement in this research was not statistically proven, even though all measurements were conducted by two experienced physicians. The design of this research, a cross-sectional study, is the last limitation. A prospective study, including long-term follow-up is needed to investigate the change in the CI with aging.
In conclusion, the CI of Korean children reported in this study will provide a valuable reference to diagnose cranial deformities and suggest candidates for helmet therapy. A more systematic approach will be available with this new CI classification for planning treatment and estimating the outcome for children with cranial deformities in Korea.
Notes
No potential conflict of interest relevant to this article was reported.
Conceptualization: Eom MJ, Kim JY. Methodology: Eom MJ, Nam HS. Formal analysis: Nam HS, Kook MJ. Project administration: Kim JY. Visualization: Nam HS, Kook MJ. Writing – original draft: Nam HS. Writing – review and editing: Han NM, Eom MJ. Approval of final manuscript: all authors.