The Formula for Health and Well-Being in Individuals With Cerebral Palsy: Cross-Sectional Data on Physical Activity, Sleep, and Nutrition
Article information

Abstract
Objective
To determine physical activity, sleep, and nutrition patterns in individuals with cerebral palsy (CP) and investigate the association of Gross Motor Function Classification System (GMFCS) and age with these health behaviors.
Methods
A cross-sectional study was conducted in an outpatient setting. Participants included adolescents and adults with CP (n=28; GMFCS level I–V; mean age 35.1±14.4 years). An Exercise Questionnaire or Leisure Time Physical Activity Questionnaire was used to measure physical activity in adolescents and adults, respectively. Sleep quality was measured using the Pittsburgh Sleep Quality Index (PSQI). An adapted version of the PrimeScreen questionnaire was used to assess nutrition. Linear regression analyses were performed to investigate the association between GMFCS and age with physical activity, sleep, and nutrition.
Results
The average total physical activity was 29.2±30.0 min/day. Seventy-five percent of the participants had poor sleep quality (PSQI score >5). Seventy-one percent reported “fair” eating behaviors; none reported “excellent” eating behaviors. Neither GMFCS nor age were significantly associated with PSQI score, PrimeScreen score, or total physical activity. A negative correlation existed between sleep quantity (hr/night) and PSQI score (r=-0.66, p=0.01).
Conclusion
The triad of health components, consisting of physical activity, sleep, and nutrition, was not associated with GMFCS or age in our sample of 28 individuals with CP, suggesting that these three health behaviors should be assessed during clinical encounters of CP in adolescents and adults at all levels of the GMFCS.
INTRODUCTION
Cerebral palsy (CP) is the most common pediatric physical disability, with an estimated prevalence ranging from 2.6 to 3.1 cases per 1,000 live births [1,2]. Although the majority of individuals with CP can expect similar life expectancies as the general population, except for those with greater severity and complexity [3], the vast majority of research in this population is focused on clinical symptom management in childhood and adolescence. Preventive medicine has become an emerging area since individuals with CP experience significant progressive functional declines, fatigue, diminished musculoskeletal mass and quality, excess adiposity, chronic physical inactivity, and increased risk for cardiovascular disease— all of which increase with age [4-7]. Collectively, these factors place individuals with CP at a greater risk for secondary chronic conditions that further contribute to disability, diminished quality of life, loss of independence and diminished life expectancy [8].
There is an increasing interest in chronic disease surveillance [6] and promotion of behavior modification for people with CP, including physical activity [9], sleep [10], and nutrition [11]. However, there have been no systematic observational studies that have examined all three of these factors comprehensively in a cohort of individuals with CP. Physical activity has been studied most extensively, where individuals with CP have been reported to be less physically active than their typically developing peers [12,13], and ambulatory individuals with CP engage in more physical activity and decreased sedentary time than non-ambulatory individuals with CP [9]. Moreover, among ambulatory adults with CP, younger age was associated with higher odds of being physically active [14].
Sleep issues are also a common occurrence among children with CP [10], which may be a product of intrinsic and extrinsic factors, such as muscle spasms or other forms of musculoskeletal pain and use of devices (e.g., orthosis, night worn splints, postural equipment), respectively [10]. Increasing awareness of the presence and the broad range of causes and consequences of inadequate sleep in people with CP throughout their lifespans is critical.
Few studies have examined the nutrition status or dietary habits of individuals with CP. One early study found that inactivity and malnutrition were relevant causes of abnormal body composition in 22 children with CP [15]. More recent research in 103 adolescents and young adults with CP without severe learning disabilities found that 27% indicated problems with nutrition [16]. To the best of our knowledge, no studies have examined nutrition in a broader age range of adults with CP in an outpatient setting.
Managing physical activity, sleep, and nutrition in a comprehensive fashion underscores the opportunity to encourage and promote the health and well-being of individuals with CP throughout their lifespans [11]. To guide clinicians, an important first step towards this goal is to observe and understand these behaviors in individuals with CP and determine if individuals with different functional levels experience different health behaviors. Therefore, the objectives of this study were to describe physical activity behaviors, sleep quantity and quality, and nutrition patterns in a cohort of individuals with CP and investigate the influence of disability severity and age on these components of health.
MATERIALS AND METHODS
This study is part of a larger on-going research investigation to examine the cardiovascular health and physical activity levels in adolescents and adults (min–max, 16–78 years) with CP [17]. A total of 53 individuals with CP who had participated in previous studies [18,19] were contacted and invited to participate in this study. All individuals with CP were eligible for inclusion provided they were able to respond to questionnaires about physical activity, sleep, and nutrition with some degree of independence. The study design was explained to the participants and their caregivers prior to obtaining written consent. Participants were asked to complete the questionnaires on their own but assistance from a caregiver was allowed if needed. Approval from the Hamilton Integrated Research Ethics Board was obtained for the study (No. HiREB 2490).
Demographic variables
All interested participants were invited to the Vascular Dynamics Laboratory at McMaster University to undergo assessments of cardiovascular health as a component of the on-going research program. During this visit, supine body height, body mass recorded using a digital wheelchair scale (Detecto Scales, FHD Series; Detecto, Webb City, MO, USA), and waist circumference were measured by the first author (PGM). Body mass index (BMI, kg/m2) was calculated by dividing the participant’s weight by their height squared. Waist circumference (cm) was measured while the participant remained in a supine position, at the end of a normal expiration, and at 4 cm proximal to the umbilicus [5]. Gross Motor Function Classification System (GMFCS) level [20] was collected through self-report, and the type of motor impairment (spastic, dyskinetic, or mixed) and topographical distribution (unilateral or bilateral) were classified according to the Surveillance of Cerebral Palsy in Europe Guidelines [21].
Physical activity
Physical activity was quantified through selected questionnaires following the protocols within the studies for adolescents and adults with CP [18,19]. For adult participants, physical activity was measured using the Leisure Time Physical Activity Questionnaire for persons with Spinal Cord Injury (LTPAQ-SCI) [22]. Leisure Time Physical Activity (LTPA) is defined as intentional activities that people choose to do during their “free” time, such as exercising, playing sports, gardening, etc.; necessary physical activities, such as physiotherapy, grocery shopping, and/or wheeling for transportation were not considered LTPA [22]. Criterion validity and test-retest reliability have been reported for the LTPAQ-SCI in individuals with SCI [22]. Mild, moderate and heavy/vigorous intensity physical activity measured by the LTPAQ-SCI were associated with those captured using the Physical Activity Recall Assessment for people with SCI (PARA-SCI) [23]. While the PARA-SCI has been validated for use in adults with CP [9], the LTPAQ-SCI was chosen for the present study owing to its lower time requirement (<5 minutes vs. 20–30 minutes for the PARA-SCI) [22]. Participants were asked to report the number of days and the number of minutes each day that they engaged in mild-, moderate-, and/or heavy/vigorous-intensity LTPA during the previous 7 days. Participants were asked to provide information about both aerobic and strength training activities. The primary outcome of this questionnaire was the total number of minutes of LTPA at each intensity level performed during the previous 7 days. These totals were combined and divided by seven to give the average amount of physical activity performed per day (i.e., min/day). The average amount of moderate-to-vigorous physical activity (MVPA) per day was calculated after collecting data regarding the total moderate and heavy/vigorous intensity level activities for 7 days and dividing this value by seven.
For adolescent participants, physical activity was measured using the Exercise Questionnaire [24]. In this questionnaire, exercise was defined as activities that involved stretching, strengthening, or physical exertion [24]. The Exercise Questionnaire was developed in part from activities within the Previous Day Physical Activity Record, with the addition of activities that were appropriate for youth with CP following consultation with an expert group [24]. These additional items were confirmed by a pilot study of youth with CP, which supported the content validity of the Exercise Questionnaire [24]. The questionnaire was designed to be completed by the adolescent with or without help from parents [24]. Test-retest reliability of the Exercise Questionnaire revealed no significant difference between two time points [24].
This questionnaire measures frequency, duration, and intensity of physical activity performed in the previous week. Total weekly duration (minute) of physical activity at all intensity levels (light, medium, or hard/vigorous) was calculated and divided by 7 to give an average amount (minutes) of physical activity performed per day.
Sleep
Sleep was measured using the Pittsburgh Sleep Quality Index (PSQI) [25]. The PSQI consists of 19 self-rated questions in seven component scores (sleep quality, sleep latency, sleep duration, habitual sleep efficiency, sleep disturbances, use of sleeping medications, and daytime dysfunction). Each component is scored from 0–3, and the sum provides a global PSQI score (maximum score 21) where higher scores indicate poorer sleep quality. Scores >5 indicate poor sleep quality [25]. The PSQI takes 5–10 minutes to complete, and approximately 5 minutes to score. The PSQI has a high degree of internal consistency (Cronbach’s α=0.83) [25], and good testretest reliability (ICC=0.85) [25]. Regarding validity, the PSQI identifies between good and poor sleepers, and compares favorably with the criterion standard of sleep disorder diagnosis through polysomnography (t-tests showed no difference for sleep latency between the two measures) [25].
Nutrition
An adapted version of the PrimeScreen questionnaire was used to measure eating behaviors and food choices over the previous 6 months [26]. The questionnaire consists of 21 questions about the average frequency of consumption of specified foods and food groups during this time period. The questionnaire highlights intake of fruits, vegetables, whole and low-fat dairy products, whole grains, fish, poultry and red meat as well as other foods that are major contributors to fat intake [26]. The questionnaire includes examples of the most frequently consumed foods pertaining to a certain food group. For example, one specific question asks, “How often do you eat… dark green leafy vegetables (spinach, romaine lettuce, mesclun mix, kale, turnip greens, bok choy, swiss chard)”. Frequency of consumption is categorized as: less than once per week, once per week, 2 to 4 times per week, nearly daily or daily, or twice or more per day with scores ranging from 0 to 4 for 11 questions, 0 to -4 for 9 questions, and -2 to 2 for 1 question. Scores from the 21 questions are totaled and eating behaviors are classified based on the following scores: ≥35, excellent; 16–34, good; 1–15, fair; and ≤0, poor [26]. The PrimeScreen has been shown to have adequate reproducibility when compared with the semi-quantitative food frequency questionnaire (131 items), with an estimated correlation coefficient of 0.59 [26]. In a study assessing the reproducibility of the PrimeScreen, participants found it easy to understand and complete, with 87% of participants requiring <10 minutes to complete the questionnaire [26].
Statistical analysis
Statistical analyses were performed using Stata 13 statistical software package (Release 13; StataCorp LLC, College Station, TX, USA). Descriptive statistics were calculated and presented as means, standard deviations, minimum, lower quartiles, medians, upper quartiles, and maximum values for continuous variables, and as frequencies for dichotomous and categorical variables. All continuous variables were tested for normality using Shapiro-Wilk descriptive tests. Linear regression was performed to investigate the relationship between GMFCS level—dichotomized into community ambulatory (GMFCS I–II) and community non-ambulatory (GMFCS III–V) (independent predictor)—and total physical activity (min/day), PSQI score, and PrimeScreen score, each as a dependent variable in separate models. Linear regression was also performed to investigate the association between age as a continuous variable (independent predictor) and total physical activity (min/day), PSQI score, and PrimeScreen score, again as dependent variables in separate models. Other correlations examined included BMI vs. PrimeScreen score, waist circumference vs. PrimeScreen score, and sleep quantity (hr/night) vs. PSQI score. A minimum criterion α level of p≤0.05 was used to determine statistical significance.
RESULTS
Participants
Physical activity, PSQI, and PrimeScreen questionnaires were completed by 28 individuals with CP (mean age, 35.1±14.4 years; min–max, 16–78 years) from a database of 53 eligible individuals [18,19]. There was no significant difference in age, BMI and waist circumference between the 28 study participants and 25 non-study participants (i.e., p>0.05) (data not shown). Table 1 displays the participant characteristics. Due to the presence of an intrathecal baclofen pump or enteral feeding tube, it was not possible to obtain waist circumference measurements at 4 cm proximal to the umbilicus of four participants. For three of these participants, waist circumference was instead measured at the border of the right anterior superior iliac crest; for one participant this was not possible as they were unable to move from the wheelchair to the testing bed.
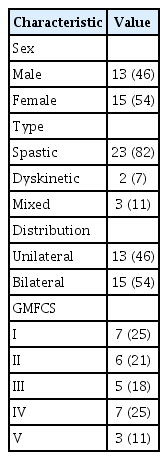
Participants’ characteristics (n=28)
Age, BMI, total physical activity, MVPA, and sleep (hr/night) were not normally distributed (Shapiro-Wilk test p<0.05). The variables, including age, BMI, and sleep were log transformed to achieve statistical normality, with these transformed variables used in subsequent statistical analyses. Visual interpretation of the variables, including total physical activity and MVPA appeared to be normally distributed, and therefore, were included in the statistical analyses as original values (Table 2).
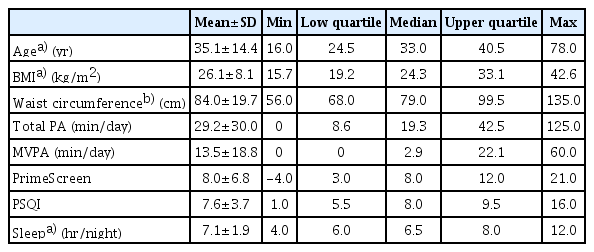
Results of variables
Physical activity
Total physical activity for participants was 29.2±30.0 and 13.5±18.8 min/day for MVPA. Overall, mean total physical activity (min/day) values by GMFCS level are displayed in Fig. 1. Twenty-two (78.6%) participants engaged in <150 minutes of MVPA per week.
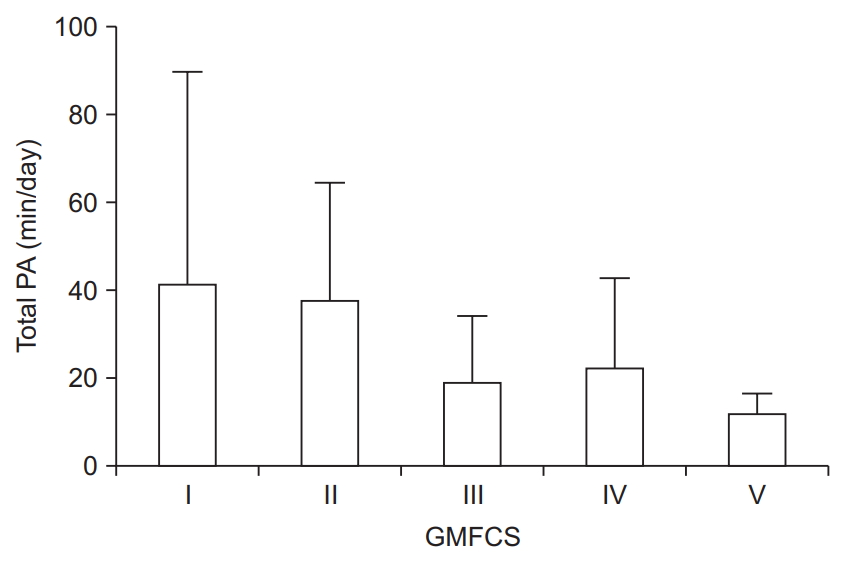
Average total physical activity (PA) for each Gross Motor Function Classification System (GMFCS) level. Error bars indicate standard deviation.
Sleep
Using the PSQI questionnaire, participants reported an average score of 7.6±3.7. Twenty-one (75%) participants had PSQI scores >5, indicating poor sleep quality, and 16 (57%) obtained <7 hours of sleep per night. Mean PSQI scores and hours of sleep per night by GMFCS level are presented in Fig. 2A and 2B. Ten (36%) participants indicated that they were using sleeping medication.
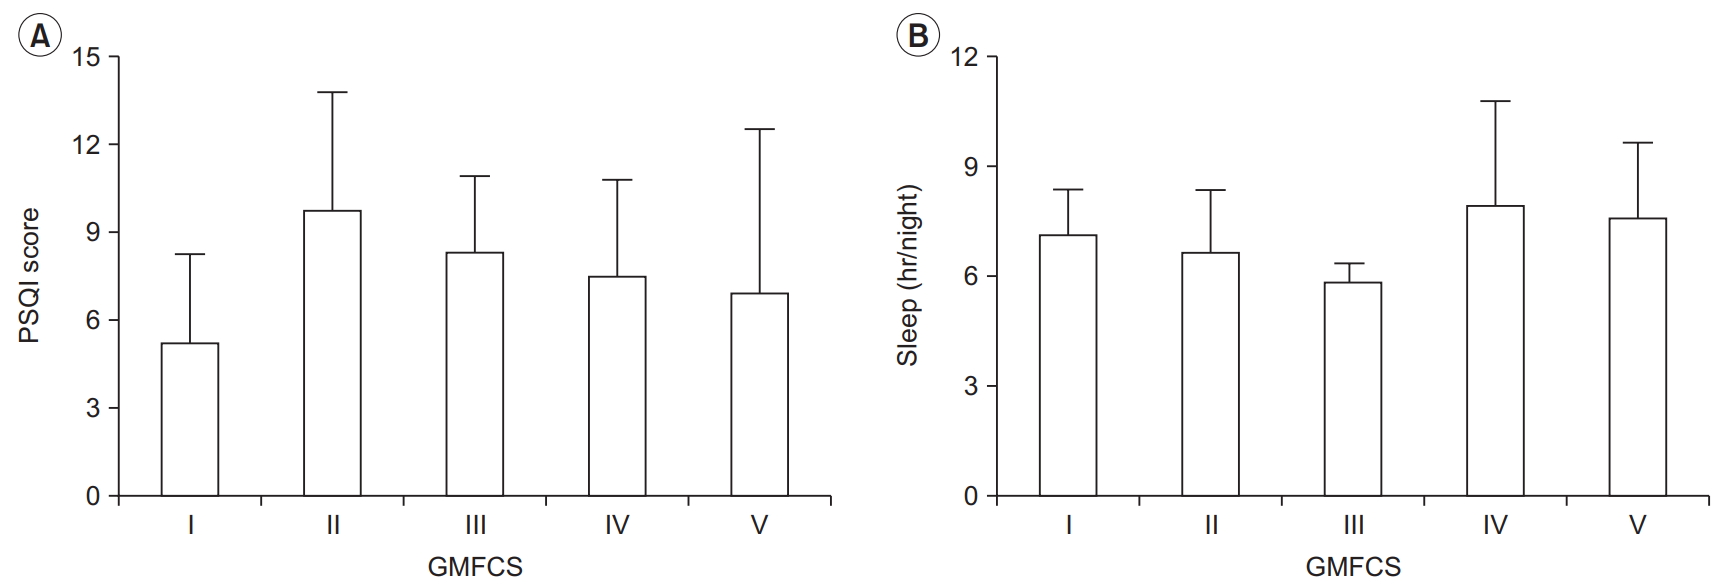
(A) Average Pittsburgh Sleep Quality Index (PSQI) score for each Gross Motor Function Classification System (GMFCS) level. (B) Average sleep hours per night for each GMFCS level. Error bars indicate standard deviation.
Nutrition
Average scores for nutrition using an adapted version of the PrimeScreen questionnaire were 8.0±6.8, which is in the fair range (score of 1–15). Only 4 (14%) participants had “good” eating behaviors (score >15), whereas 4 (14%) participants had “poor” eating behaviors (score of ≤0). Mean PrimeScreen scores by GMFCS level are presented in Fig. 3.
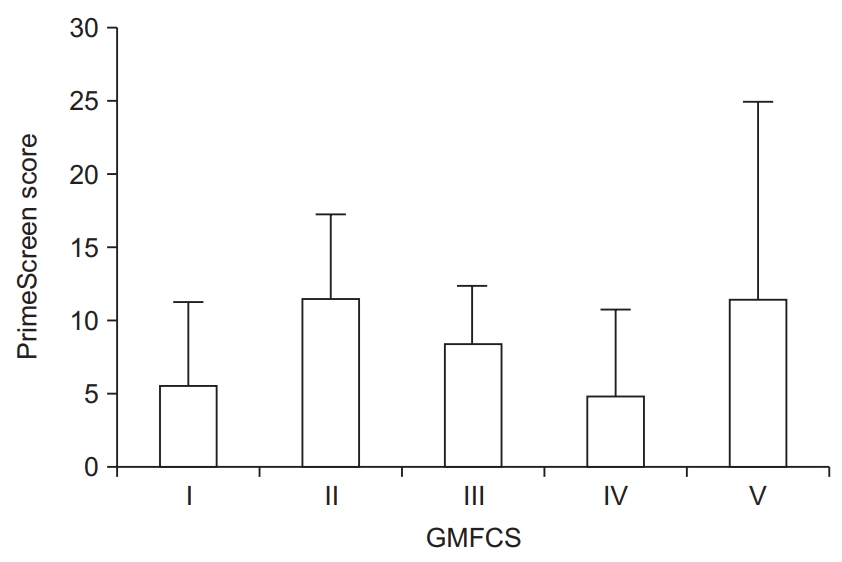
Average PrimeScreen score for each Gross Motor Function Classification System (GMFCS) level. Error bars indicate standard deviation.
Predictors of sleep, nutrition, and physical activity
GMFCS was not an independent predictor of PSQI score (β=0.35; p=0.81; 95% CI, -2.55 to 3.25), PrimeScreen score (β=-0.93; p=0.72; 95% CI, -6.28 to 4.42), or total physical activity (min/day) (β=-20.5; p=0.07; 95% CI, -42.9 to 1.79).
Similarly, age was not an independent predictor of PSQI score (β=1.74; p=0.35; 95% CI, -0.06 to 0.14), PrimeScreen score (β=-1.63; p=0.64; 95% CI, -0.24 to 0.13), or total physical activity (min/day) (β=-17.5; p=0.25; 95% CI, -1.17 to 0.48). We did not see any correlation between BMI and PrimeScreen score (r=0.15, p=0.44) (Fig. 4A) or waist circumference and PrimeScreen score (r=0.03, p=0.89) (Fig. 4B). A negative correlation existed between sleep quantity (hours) and PSQI score (r=-0.66, p=0.01) (Fig. 4C).
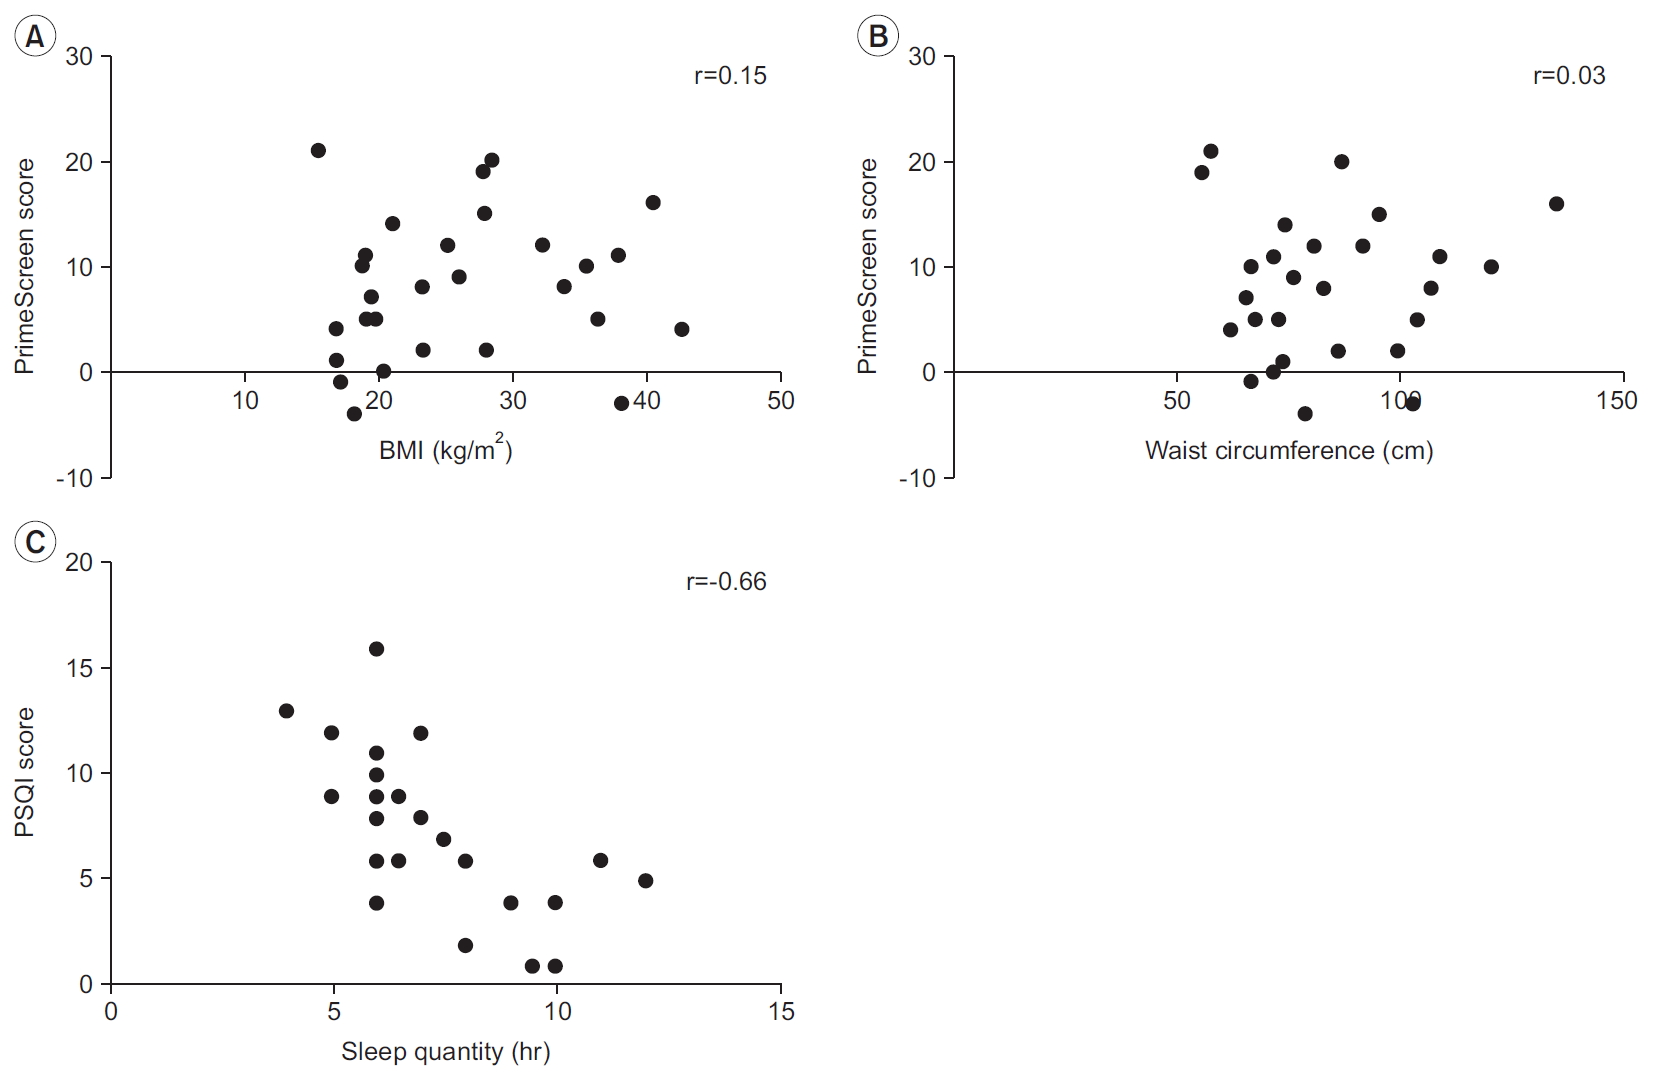
(A) Pearson correlation between BMI and PrimeScreen score. (B) Pearson correlation between waist circumference and PrimeScreen score. (C) Pearson correlation between sleep quantity and PSQI score. BMI, body mass index; PSQI, Pittsburgh Sleep Quality Index.
DISCUSSION
Results from this study suggest that physical activity behaviors, sleep quantity and quality, and nutrition of adolescents and adults with CP require attention from clinicians. Importantly, severity (GMFCS I–II vs. III–V) and age were not significantly associated with any component of health, suggesting that these three health variables should be assessed during clinical encounters of CP in all adolescents and adults, regardless of the GMFCS level.
Clinicians working with individuals with CP often presume that patients with higher functioning experience less health problems than those with lower functioning. Indeed, there is empirical evidence to support this presumption with regard to physical activity and sedentary behavior, as we have previously shown that adults with CP who have higher functioning engage in more habitual physical activity than those with lower functioning [9]. Regardless, overall physical activity is lower in adolescents [27] and adults [13] with CP compared with the general population. This is reflected in the present study, where almost 80% of participants reported engaging in <150 minutes of MVPA per week, which are the current recommendations by the World Health Organization for adults aged 18–64 years [28]. Individuals classified as GMFCS levels IV and V reported some involvement in light intensity activities, which is a great starting point that may lead to health gains [29]. However, individuals with GMFCS level V in this study did not engage in any moderate-to-vigorous physical activities.
Although some literature exists regarding a negative association between age and physical activity in adults with CP [14], age was not associated with physical activity in this study. The reason for no association between age and physical activity could be due to a small sample size. Acknowledging not only the challenges and difficulties of those with excessive mobility limitations to engage in MVPA, but also proper nutrition and sleep management may also be critical for optimal health of individuals with CP [11]. Results from the present study illustrate, at the very least, assessment techniques for clinicians to capture and discuss with patients with CP the equally important health variables of physical activity, sleep, and nutrition.
It is well-known that sleep is an essential biological function with important roles in recovery, conservation of energy, and survival [30]. Insufficient sleep or patterns of sleep that interfere with physical and mental wellbeing can result from deprivation of sleep or decreased sleep quality. In the present study, 75% of the participants had poor sleep quality, indicated by a PSQI score >5. Moreover, more than half of the participants were getting less than the recommended 7 hours of sleep per night for adults [30]. When compared with the general population, 35.2% of Americans obtain less than 7 hours of sleep per night [31]. We found a significant negative association between sleep quantity (hr/night) and PSQI score, which suggests that low sleep quantity is related to increased PSQI score in this group of individuals with CP. A simple solution may be to increase sleep quantity, but this approach minimizes the complexity of factors that potentially influence the hours of sleep per night for individuals with CP. For example, someone with spastic CP might awaken in the night frequently due to muscle spasms, which in turn, would affect sleep duration. There is some evidence in children and adults with CP that injections with botulinum toxin serotype A or oral baclofen, respectively, reduces spasticity and improves sleep [32,33]. However, it is important for clinicians to be mindful of the use of spasticity medications to assist with sleep, given that a component of the global PSQI score is use of sleeping medications. A person with CP may associate medical treatment of spasticity with sleep assistance, and in turn, score higher in that component of the PSQI. Thus, clinicians need to check if patients with CP are on sleeping pills and getting spasticity management when assessing sleep quality and quantity. Of the 10 participants in the present study who used medication to assist with sleeping, 8 had poor sleep quality.
There were no individuals with CP who reported excellent nutritional intake, again highlighting the important opportunities to improve in this area. We were able to use the feasible PrimeScreen questionnaire in adolescents and adults with CP in the present study to identify persons with suboptimal diets. The questionnaire has been shown to be easily understood and can be completed by most participants in <10 minutes [26], and can be readily applied in clinical settings. Future research may include the use of the PrimeScreen in combination with the Eating and Drinking Ability Classification System (EDACS) [34]. The EDACS is a system that describes functional eating and drinking ability in people with CP from 3 years of age and older [34]. Assessing nutrition and eating/drinking ability together would afford an opportunity to understand the relationship between “what” and “how” individuals with CP eat.
Taken together, the triad of physical activity, sleep, and nutrition assessed in a comprehensive manner will allow clinicians to better understand modifiable behaviors that can prevent negative health consequences in adolescents and adults with CP. Although GMFCS was not a significant predictor of any one of the three health components, recommendations can be made for clinical care. Individuals who were GMFCS level I reported, on average, the highest amount of physical activity, lowest PSQI score, but the second lowest PrimeScreen score. These initial findings indicate, although in a small sample of individuals with CP, that those who are GMFCS level I could benefit from dietary consultation to improve their overall health. On the other end of the spectrum, individuals with GMFCS level V had the highest PrimeScreen score, second lowest PSQI score, but the lowest total physical activity levels. This suggests that while physical activity should be promoted in this group, given the challenges to engage in physical activity for individuals with severe mobility limitations [29], clinicians may also strongly encourage continued good sleep and nutrition.
Future research investigating this health triad in persons with CP should do so in a larger sample across multiple sites, while assessing associations between measures of body composition and risk factors of cardiovascular disease, which will allow for better generalizability and clinical implications of the findings.
Limitations
We present results for the triad of health in our study across all five levels of the GMFCS. Our findings should be interpreted with caution owing to the small number of participants. The use of subjective questionnaires to assess the components of health could have resulted in social desirable response bias [35]. Additionally, individuals volunteered to participate in this study, and therefore, could be more health conscious than a random sample from the community.
Another limitation in this study was the use of two questionnaires to assess physical activity. A notable difference between these questionnaires is that the Exercise Questionnaire asks participants whether or not they participated in specific exercises and their intensities in the last 7 days. However, there is an opportunity for participants to mention other exercises that they may have participated in that were not included in the questionnaire [24]. The LTPAQ-SCI asks participants about the frequency and duration of light, moderate, and heavy/vigorous intensity activity performed in the previous 7 days [22]. Despite this difference, both afford an opportunity to quantify total and moderate to heavy/vigorous physical activity, allowing for a meaningful aggregation of responses from the two questionnaires. Finally, recent research suggests that BMI does not accurately estimate fat mass index in individuals with CP [36]. However, we did include measures of waist circumference, and a previous study did reveal a positive association between waist circumference and cardiometabolic disease risk in adults with CP [37].
Conclusion
The triad of health components, consisting of physical activity, sleep, and nutrition, were observed in a group of adolescents and adults with CP inclusive of all five levels of the GMFCS. Severity or age was not predictive of any component of health, emphasizing the importance of assessing the triad of health in adolescents and adults with CP, regardless of the level of severity.
Notes
Dr. Jan Willem Gorter holds the Scotiabank Chair in Child Health Research. The other authors declare that there is no conflict of interest.
Acknowledgements
This project was inspired by a Letter to the Editor from 2016 [11]. We would like to acknowledge and thank the study participants for taking part in the study.
Notes
Conceptualization: McPhee PG, Verschuren O, Gorter JW. Methodology: McPhee PG, Verschuren O, Tang A, Gorter JW. Formal analysis: McPhee PG, Peterson MD. Writing – original draft: McPhee PG. Writing – review and editing: all authors. Approval of final manuscript: all authors.