The Nutritional Status and the Clinical Outcomes of Patients With a Spinal Cord Injury Using Nutritional Screening Tools
Article information

Abstract
Objective
To assess the nutritional status of Korean patients with spinal cord injury (SCI), identify the predictors of undernutrition, and investigate the relationship between undernutrition and clinical outcomes.
Methods
A retrospective study design was used to determine the nutritional status of 130 patients over 19 years old admitted to the rehabilitation hospital of Yonsei University Health System between June 2015 and February 2017. The nutritional status was assessed using the malnutrition universal screening tool (MUST) and the spinal nutrition screening tool (SNST). The relationship between undernutrition and clinical outcomes was examined by comparing a low-risk group with an at-risk group using a t-test.
Results
Among the SCI patients, 70 (50.8%) were confirmed with undernutrition based on the MUST scores, while 60 (46.2%) had undernutrition based on the SNST scores. It was found that undernutrition has an effect on functional outcomes.
Conclusion
We assessed the undernutrition risk in Korean SCI patients, and found that approximately 50% of the patients were at risk of undernutrition. We also found that undernutrition can affect functional recovery.
INTRODUCTION
Appropriate nutritional support is important for the care of hospitalized patients. Undernutrition goes undetected and untreated in many instances, and leads to a wide range of adverse consequences. Evidence from the review of existing literature showed undernutrition to be a common occurrence among patients and has reported percentages ranging from 13%–78% [1,2]. The risk of undernutrition is high among patients diagnosed with spinal cord injury (SCI), and has been reported at 17.4%–46.7% [3,4]. Undernutrition can increase the risk of various complications including infections, impaired wound healing [5], increased hospital stay, and high mortality rates [6].
Drastic changes in the body composition occur following SCI. These include a reduction in the lean soft tissue mass, an increase in fat mass, as well as reductions in the metabolic rate, and in positive energy balance. In addition, the level of physical activity decreases and energy demand increases after an injury event occurs [7,8]. During the acute phase, following an injury, weight loss commonly occurs due to the continued catabolic status [9]. During the chronic phase, the catabolic phase is resolved, but weight gain tendency increases as low activity levels and low metabolic rate continue [10]. Therefore, the determination of adequate amounts of nutritional demand and supply via dietetic assessment is important for SCI patients following their hospital admission. The use of nutritional screening tools is also an important step in nutritional care. Many nutritional screening tools have been developed to assess the nutritional status of hospitalized patients. In this study, we assessed the nutritional status using the malnutrition universal screening tool (MUST) and the spinal nutrition screening tool (SNST).
Major guidelines on the use of nutritional screening tools that assesses various nutritional markers include those developed by the European Society for Parenteral and Enteral Nutrition (ESPEN) and the American Society for Parenteral and Enteral Nutrition (ASPEN). The guide-line published by the ESPEN in 2002 recommends the use of the MUST, the Nutritional Risk Screening 2002 (NRS-2002), and the mini-nutritional assessment (MNA) in the assessment of patients in local communities, inpatients, and advanced age patients, respectively [11,12]. The ASPEN recommends the subjective global assessment (SGA), which was initially developed to assess surgical patients, but was suggested as significantly beneficial when applied to the malnutrition assessment of patients with various diseases including renal failure, cancer, and hepatic diseases [13,14]. Velasco et al. [15] compared four different nutritional screening tools for nutritional risk detection, and found the MUST, NRS-2002, and SGA to be appropriate for screening of inpatients’ nutritional status. This is because screening tools ideally should not require too much time and examiner training, and the MUST and the NRS-2002 are simpler compared to the more complex MNA and SGA. Therefore, the MUST and NRS-2002 are the most apt for inpatient assessment.
The SNST [16] is a SCI-specific nutritional screening tool that was developed to overcome the limitation of other nutritional screening tools where changes in the body composition (following the injury of the SCI patients), gave rise to false results. The SNST is the only SCI-specific nutritional screening tool that targets adults. The SNST was initially developed in 2012. Although there is a lack of follow-up studies to validate the SNST relative to the other nutritional screening tools mentioned previously, Wong et al. found the SNST to be a valid (sensitivity 85.7%, specificity 76.1%, PPV 62.0%, NPV 92.0%), and reliable tool (inter-rater reliability k=0.5, intra-rater reliability k=0.64) [16]. Research on malnutrition, particularly, undernutrition in patients with SCI is lacking worldwide and desperately needed.
The aim of this study was to (1) assess the early nutritional status of Korean SCI patients admitted to the rehabilitation hospital of Yonsei University Health System by using the MUST and SNST, and to analyze various nutritional markers; (2) investigate the association between early nutritional status and nutritional markers; and (3) examine the correlation between the nutritional status of SCI patients and clinical outcomes by looking at changes in the functional outcomes measured at the time of hospital admission and at discharge.
MATERIALS AND METHODS
Participants
A retrospective study was conducted to identify patients who were admitted to the rehabilitation hospital of Yonsei University Health System between June 2016 and February 2017, and who met the following inclusion criteria: (1) patients aged 19 years or older; and (2) cases of nonprogressive traumatic and non-traumatic SCI. Patients who had psychotic disorders, brain injury, or multiple fractures were excluded. Ethical approval was granted by the Institutional Review Board (No. 4-2017-0670) and Ethics Committee of Severance Hospital.
Malnutrition assessment
Nutritional risk was assessed by the MUST and SNST, which are generic nutrition screening tools. The MUST [17,18] is a nutritional screening tool developed by the British Association for Parenteral and Enteral Nutrition (Fig. 1). The SNST assesses 8 criteria: history of recent weight loss, body mass index (BMI), age, level of SCI, presence of comorbidity, skin condition, appetite and ability to eat. Each criterion is rated from 0 to 5 points. Total scores reflect the undernutrition risk, and the risk was divided into three stages (Fig. 2).
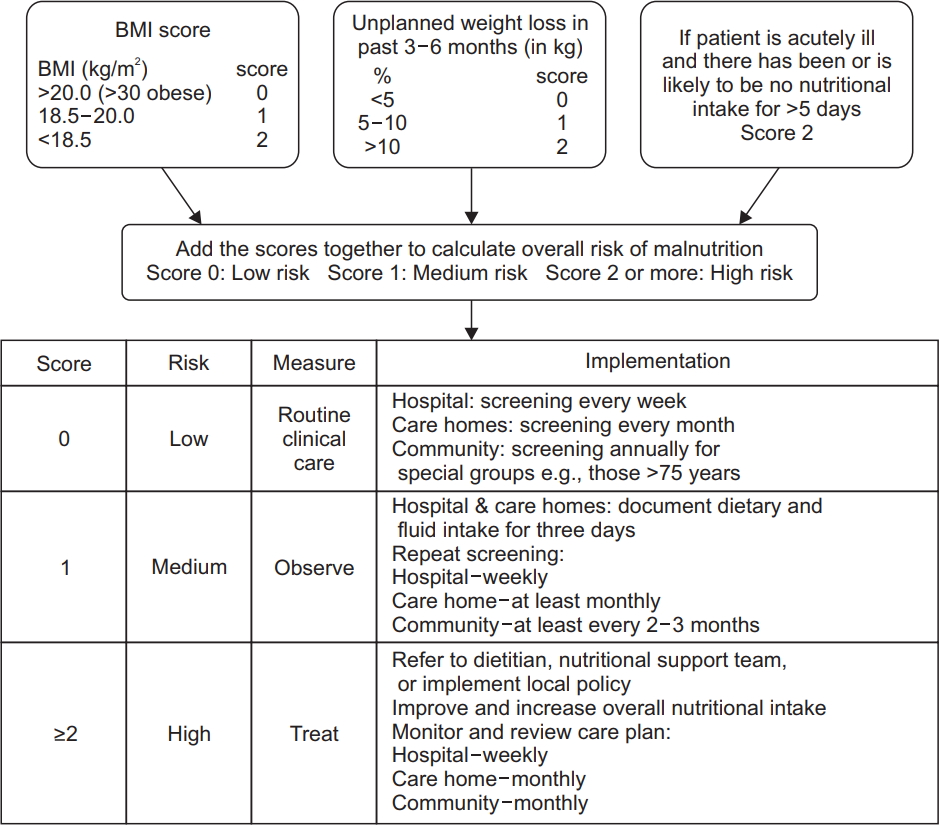
Malnutrition universal screening tool (MUST). Three independent criteria were used to determine the overall risk for malnutrition: current weight status using body mass index (BMI), unintentional weight loss, and acute disease effect that has induced a phase of nothing by mouth for >5 days. Each parameter can be rated as 0, 1, or 2. Overall risk for malnutrition is established as low (score=0), medium (score=1), or high (score≥2).

Spinal nutrition screening tool (SNST). Weight was measured to the nearest 0.1 kg using calibrated ward scales or if the patient could not be weighed, then this was estimated or a recently recalled weight was used. Standing height measurement was not realistic. So recalled pre-injury height was used, or height was estimated by one of the alternative methods recommended by the British Association for Parenteral and Enteral Nutrition. Body mass index (BMI) was calculated and weight history scored accordingly. If neither weight nor BMI could be obtained, subjective criteria assessing recent visible weight loss was used. The percentage of unintentional weight loss in the last 3–6 months was calculated from the difference between of pre-injury weight and weight on admission (some, 5%–10%; moderate, 11%–15%; marked, >15%). Age, level of spinal cord injury, presence of co-morbidities, skin condition, diet, appetite, and ability to eat were scored using data obtained from a standardized admission pro forma.
In this study, patients were in the low-risk of undernutrition using the MUST, if they scored 0 points and at-risk if they scored one or more points. Similarly, patients were in the low-risk group if they scored 10 points or less on the SNST and in the at-risk group if they scored 11 points or more.
Differences in the baseline demographics between the low-risk and at-risk groups were examined including: clinical characteristics, blood tests, and body composition (measured by body composition analysis). The clinical characteristics examined included age, sex, time post-injury, level of spinal cord injury, completeness of injury, American Spinal Injury Association (ASIA) impairment scale score, weight, and height. The blood tests examined included the complete blood count, C-reactive protein (CRP), blood urea nitrogen (BUN), creatinine (Cr), protein, albumin, and electrolyte levels. The body composition analysis included skeletal muscle mass, body fat, percent body fat, intracellular water, extracellular water, and total body water.
Undernutrition and clinical outcomes
Participants underwent the following tests within 2 days of hospital admission: laboratory tests, body composition analysis, physical examination (including manual muscle testing and a sensory test), and initial functional status assessments—Functional Independence Measure (FIM), Modified Barthel Index (MBI), Spinal Cord Independent Measure III (SCIM-III). A follow-up physical examination and an assessment of the functional status were performed within an average of 46.9±21.5 days before discharge. To investigate the association between undernutrition and clinical outcomes, changes in the functional status assessment results, total AMS and ASS scores measured at admission and discharge were compared with the low-risk group and the at-risk group by t-test.
Statistical analysis
All data were analyzed using SPSS statistical software version 20.0 (IBM, Armonk, NY, USA). The continuous variables (age, period after injury, height, body weight, weight loss, BMI, skeletal muscle mass, and percent body fat) were expressed as mean±standard deviation, and analyzed using the Student t-test. The categorical variables (sex, level of injury, and motor completeness of injury) were expressed as a count (%), and analyzed using the chi-square test. The level of statistical significance was set at p<0.05.
RESULTS
Participants
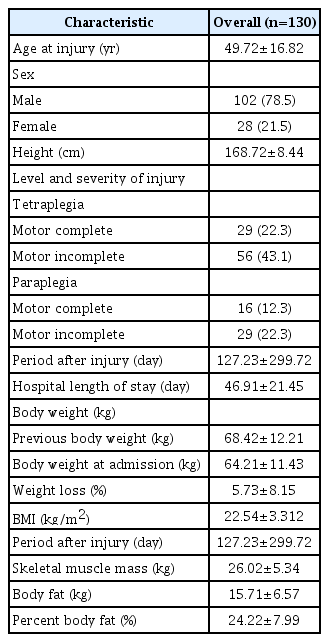
A total of 130 SCI patients (78.5% male, and 21.5% female) aged 19–84 years (mean age, 49.7±16.82 years) were included in this analysis (Table 1). The participants were classified as tetraplegia (C2 to T1) or paraplegia (T2-L5); and motor complete (ASIA A or B) or motor incomplete (ASIA C or D) based on their neurological level of injury (NLI) and the ASIA classification scale. Twenty-nine patients (22.3%) were classified as having motor complete tetraplegia, 56 patients (43.1%) as having motor incomplete tetraplegia, 16 patients (12.3%) as having motor complete paraplegia, and 29 patients (22.3%) as having motor incomplete injuries.
Characteristics of participants
Nutritional risk distribution
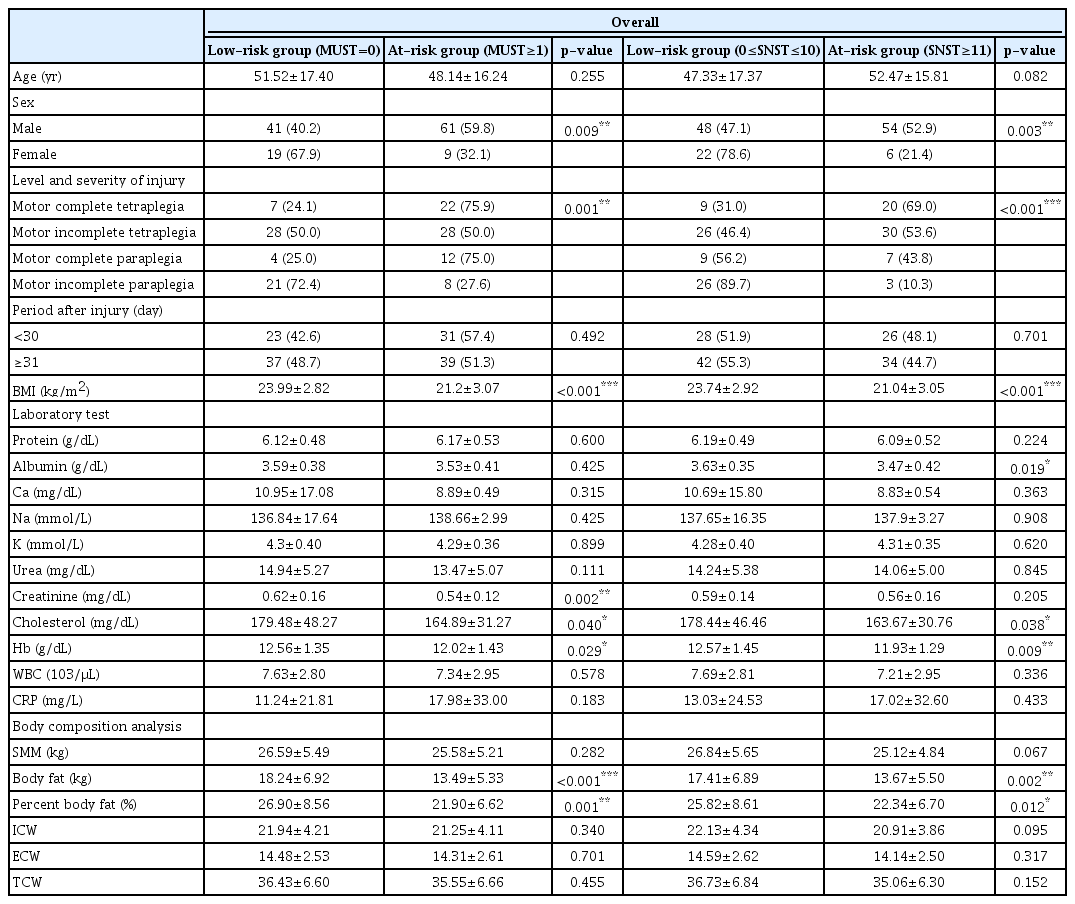
A total of 130 SCI patients were assessed using two different nutritional screening tools (Table 2). Seventy patients (50.8%) were at-risk based on the MUST scores, and 60 patients (46.2%) were at-risk based on the SNST scores. Both nutritional screening tools showed that a significant number of male patients with complete motor injuries were at risk for undernutrition. A significant number of patients in the at-risk group had tetraplegia versus paraplegia when assessed with the SNST; however, with the MUST assessment no such significant difference was found. Among the body composition analysis measured through the laboratory and other parameters measured through the body composition analysis shown in Table 3, those that could be used as nutritional indices were compared based on MUST and SNST scores. Creatinine and albumin concentrations were significantly lower in the at-risk group based on the MUST and SNST assessment results. With both nutritional screening tools significantly lower cholesterol, hemoglobin (Hb) concentrations, BMI, body fat, and percent body fat were shown in the at-risk group.

Distribution of MUST and SNST scores according to level of spinal cord injury and degree
Comparison of nutritional index according to nutritional status
Relationship between undernutrition and clinical outcomes
To investigate the association between undernutrition and clinical outcomes, the functional status assessment was performed including FIM, MBI, and SCIM-III. Changes in functional status showed significant differences between the low-risk and the at-risk groups. The comparison of the motor and the sensory recovery between the two groups showed lower levels of recovery during the follow-up period for the at-risk group compared to the low-risk group; though the difference was not statistically significant (Table 4).

The association between nutritional screening tool scores and clinical outcomes
DISCUSSION
The major aim of this study was to use the MUST and the SNST to assess the nutritional status of 130 Korean SCI patients. In previous studies, multi-faceted research on malnutrition related to hospitalized patients’ care were conducted. Various nutritional markers that can be used in nutritional screening include height, weight change, subcutaneous fat, and total body protein mass [19]. All of these nutritional markers are measured, in anthropometric assessments, as biochemical markers, to examine patient’s clinical condition, and to assess the ability to eat. However, controversy exists regarding the nutritional markers that are most appropriate in the assessment of nutritional status. In the assessment of patients’ nutritional status, the use of a variety of markers instead of a single marker should be considered. Wong et al. [3,4] conducted a cross-sectional, multi-center study to investigate the prevalence of malnutrition among SCI patients in the United Kingdom by using the MUST, and the undernutrition risk among patients diagnosed with SCI was reported as 17.4%–46.7%. In this study, where MUST and SNST were used for the nutritional screening, 70 patients (50.8%) and 60 patients (46.2%) had under-nutrition risk based on the MUST and the SNST scores, respectively. The findings of our study are consistent with the findings of the previous literature [3,20]. The likelihood of being assessed as having undernutrition was higher for male patients with complete motor injuries when the MUST was used and also higher for male patients with complete motor injuries and tetraplegia when the SNST was used. Similarly, in a study by Chao et al. [18] on cancer patients, the risk for undernutrition was three times higher among male patients than female patients. However, the assessment of the undernutrition risk based on the NLI and ASIA classification scale (completeness of injury) was published for pediatric SCI patients only [21]. Assessment using STAMP scores showed a higher undernutrition risk for the tetraplegia group compared to the paraplegia group (82.2% vs. 47.5%). And for the complete motor injury group compared to the incomplete motor injury group (51.7% vs. 50.0%); however, the differences in this risk were not statistically significant. The inconsistency between these results and our results may be attributed to the fact that the STAMP assessment involved pediatric SCI patients, and used a small sample size of 45 patients.
The findings of our study indicate that both nutritional screening tools showed cholesterol and hemoglobin concentrations to be lower in the at-risk group. Creatinine levels and albumin concentrations were also significantly lower for the at-risk group with MUST and SNST respectively. In a study conducted by Wong et al. [3], the MUST, protein, albumin, CRP, Hb, Cr, and BMI were significantly lower in the at-risk group. In a later study by Wong et al. [20], the SNST, protein, albumin, CRP, Hb, white cell count, and BMI were significantly lower in the at-risk group. Studies have commonly used the following tools to assess blood test indices and nutritional status: the prognostic nutritional index, the prognostic inflammatory, the nutritional index, and the Maastricht index [22-24]. However, these indices have large periodic variations that reflect individual patients’ nutritional status and reflect other clinical patterns besides the nutritional status. Hence, these indices must be used in conjunction with other markers to assess the patients’ nutritional status. Furthermore, it may be more clinically useful to use a single measurement from a blood test to determine whether or not a patient’s nutritional status has improved following nutritional support, rather than using many measurements. This study was also aimed at investigating the association between the body composition parameters and nutritional status. Only body fat and percent body fat were found to be significantly low in the at-risk group. Further research is necessary to understand the implication of this significant finding.
Many studies have reported on the association between undernutrition and clinical outcomes such as the length of hospital stay and the mortality rate. Repeatedly, it was found that undernutrition increases the length of hospital stay and mortality rates [5,6,20,25,26]. In this study, we investigated the association between undernutrition and the clinical outcomes including motor and sensory recovery, and the changes in functional status assessment results of SCI patients (Table 4). In the functional status assessments (FIM, MBI, SCIM-III), significant differences were found between the low-risk group and the at-risk group. The level of motor and sensory recovery was lower in the at-risk group compared to the low-risk group, but not by a significant difference. There was no difference in neurological recovery (motor scores and sensory scores) according to nutritional status. However, functional recovery was significantly different between groups with different nutritional status. In addition, the reason why functional status assessment results were more significantly correlated with nutritional status compared to the motor sensory recovery may be because the nutritional screening tools also assessed medical problems, and the functional status of the patients may have been compromised due to deconditioning.
Limitations
The present study was a retrospective study. All inpatients had to receive nutritional support after consulting the nutrition team. As a result, the influence of undernutrition on clinical outcomes may have been affected by this factor.
In this study, malnutrition was assessed by using the MUST and SNST. Although both nutritional screening tools have been validated in many studies, they may be inadequate for Korean SCI patients as they were developed for Western patients. Furthermore, due to limited human resources available and limited time in Korean hospitals, there is difficulty in applying the tools, as they exist, to Korean patients. Therefore, nutritional screening tools that have been adapted to the characteristics of Korean SCI patients must be developed through large-scale research in the future.
In conclusion, the nutritional status of 130 Korean SCI patients was assessed using the MUST and the SNST. About 50% of the patients had undernutrition risk. Furthermore, undernutrition was found to affect functional recovery. The development and validation of nutritional screening tools that are appropriate for Korean SCI patients is necessary. It is essential to ensure that the nutritional status of SCI patients be appropriately addressed using an early nutritional assessment with early nutritional support immediately following their hospital admission.
Notes
No potential conflict of interest relevant to this article was reported.