Quantitative Evaluation of Post-stroke Spasticity Using Neurophysiological and Radiological Tools: A Pilot Study
Article information

Abstract
Objective
To determine the possibility of a new measurement tool using electromyography and ultrasonography for quantitative spasticity assessment in post-stroke patients.
Methods
Eight hemiplegic stroke patients with ankle plantarflexor spasticity confirmed by a Modified Ashworth Scale (MAS) were enrolled. Spasticity was evaluated using the MAS and Modified Tardieu Scale (MTS). Each subject underwent surface electromyography (sEMG) using the Brain Motor Control Assessment (BMCA) protocol and was compared with a healthy control group. Using ultrasonography, muscle architecture and elasticity index were measured from the medial gastrocnemius muscle (GCM) on the affected and unaffected sides.
Results
MAS and MTS revealed significant correlation with sEMG activity. The fascicle length and pennation angle were significantly decreased in the medial GCM on the hemiplegic side compared with the unaffected side. The elasticity index of the spastic medial GCM was significantly increased compared with the unaffected side. The MTS X and R2–R1 values were significantly correlated with the elasticity index in the hemiplegic GCM. The relationship between clinical evaluation tools and both BMCA and sonoelastography was linear, but not statistically significant in the multiple regression analysis.
Conclusion
The BMCA protocol and ultrasonographic evaluation provide objective assessment of post-stroke spasticity. Further studies are necessary to conduct accurate assessment and treatment of spasticity.
INTRODUCTION
Spasticity has been defined as “a motor disorder characterized by a velocity-dependent increase in tonic stretch reflex (muscle tone) with exaggerated tendon jerks, resulting from hyper-excitability of the stretch reflex as one component of the upper motor neuron (UMN) syndrome” [1]. It is one of the most common complications in patients with stroke. Uncontrolled spasticity causes pain and limited activities of daily living. It is critical to assess spasticity accurately to choose a better treatment option and predict the prognosis in each patient.
The most commonly used tools for the assessment of muscle spasticity are the Ashworth or Modified Ashworth Scale (MAS) and Tardieu or Modified Tardieu Scale (MTS) [2], subjective clinical tests and thus may not be as reliable as physiological techniques [3]. Neurophysiological and biomechanical methods have been used for the quantification of spasticity. However, they have several limitations. Biomechanical methods such as isokinetic dynamometers need a large-sized device and have poor mobility [4]. Electrophysiological measures, such as Hoffmann-reflex and F-wave, do not have standardized protocol or measurement parameters, and biomechanical variation among subjects is not considered [5]. Therefore, these assessment tools are not used routinely in clinical practice.
Surface electromyography (sEMG) has been used since the early 1970s for myoelectric control [6]. The sEMG is noninvasive, relatively easy to perform, and provides a quantitative measure of the central nervous system (CNS) output to muscles. The Brain Motor Control Assessment (BMCA) protocol, which has been developed over the past decade, is a sEMG-based measure of motor output from the CNS during a variety of reflex and voluntary motor tasks performed under strictly controlled conditions [7]. Previous studies have shown improved subclinical function by BMCA and motor evoked potentials (MEP) in the absence of clinical progress in brain-injured patients [8]. The ability of these neurophysiological tools to detect subclinical improvement suggests their potential application as objective measures to supplement clinical evaluation. Despite valuable information provided by BMCA to quantify motor control, limited data is available from the BMCA protocol for stroke patients.
Ultrasonography reveals morphological changes in spastic muscle architecture and facilitates the assessment of the muscle fascicle. However, the conventional ultrasonography does not delineate muscle stiffness that may be related to spasticity. Ultrasound elastography is a recently developed technique that measures tissue elasticity. Among the elastography techniques, sonoelastography is the most commonly used technique and is based on low-frequency compression of the tissue that is usually applied manually via a hand-held ultrasound transducer [9,10]. It reveals stiffness by applying stress to the tissue and detecting strain. Understanding the changes in muscle architecture and stiffness in stroke patient is essential to determine the nature of spasticity for appropriate treatment.
The purpose of this study was to quantitatively assess post-stroke spasticity using two different methods (sEMG and ultrasonography) and to define their correlation with clinical spasticity, as assessment tools.
MATERIALS AND METHODS
Subjects
Eight subjects with stroke and 8 healthy controls participated in this study. Healthy subjects underwent only BMCA protocol. Post-stroke patients admitted to the Department of Rehabilitation Medicine of Konyang University Hospital from May 2016 to March 2017 were enrolled according to the following inclusion criteria: (1) diagnosis of stroke confirmed by brain computed tomography or magnetic resonance imaging; (2) patients older than 18 who experienced their first stroke; and (3) patients with ankle plantarflexor spasticity of ≥1 point on the MAS. Exclusion criteria were (1) patients who could not perform motor tasks because of severe cognitive impairment; (2) recurrent stroke before assessment; (3) other neurological or muscular disorders; (4) previous botulinum toxin or neurolytic agent injection into the medial gastrocnemius muscle (GCM) in the last 6 months prior to enrollment; and (5) fixed ankle contracture.
This study was approved by the Institutional Review Board of Konyang University Hospital (No. 2016-05-015), and informed consent was obtained from all subjects.
Clinical evaluation
Ankle plantarflexor spasticity was evaluated using the MAS and MTS. For convenience, the MAS scores were substituted by setting different grades: Grade 1 to 1, Grade 1+ to 2, Grade 2 to 3, Grade 3 to 4, and Grade 4 to 5. The Penn Spasm Frequency Scale (PSFS) and the Spasm Frequency Score (SFS) were also used to examine the validity of a clinical measure of spasms and clonus. The motor assessment scales used were the Medical Research Council grading system (MRC, 0–5) and Fugl–Meyer Motor Assessment Scale (FMA). The motor subscore of the FMA is a validated measure with a score ranging from 0 to 34 points for the lower extremity (FMA-LE) in which a higher score indicates better lower limb function. Before conducting the BMCA protocol, all patients underwent clinical evaluation by the same clinician.
The Brain Motor Control Assessment
In this study, the BMCA protocol was modified based on adapted rules from the protocol originally reported by Sherwood et al. [7]. The test was conducted with participants placed in the supine position in a quiet and warm room with minimal distractions. The sEMG of 10 muscles (five muscles from each side) were recorded with pairs of surface electrodes. These electrodes were placed in the midline of the muscle belly and oriented on a line parallel to the muscle fibers for the right and left quadriceps (Q), hip adductor (A), hamstring (H), tibialis anterior (TA), and triceps surae (TS) muscles. The skin under the electrodes was prepared to reduce electrode impedance below 5 kΩ. In this paper, we focused on the voluntary movement segment of the BMCA protocol. The maneuver included a bilateral task with two phases (ankle dorsiflexion/plantarflexion) and unilateral task with two phases that were conducted bilaterally. All voluntary tasks were repeated three times.
The originally recorded, full bandwidth sEMG data was reduced using a root mean square (RMS) algorithm over the 5-second interval to produce sEMG envelopes with an effective sampling rate [11]. We averaged three repeated activities for each muscle, corrected for the baseline by subtraction of the average activity computed over the 1 second immediately preceding the maneuver [12]. This set of values, one for each muscle, comprised the response vector (RV) for each phase of a task [11]. They were presented in units of μVRMS for each of the scalar elements. This RV was also reduced to a single variable by averaging five muscle activities to create the average limb response (ALR), again with units of μVRMS [13]. The RV for each task from eight neurologically intact participants was used as a normal pattern to evaluate voluntary movements in stroke patients. The average of RVs across the eight control subjects was used to generate a prototype response vector (PRV) [11]. These values were used to calculate the similarity index (SI) that compares relative distribution across the set of muscles selected for the task [11]. The SI value, a numerical expression of the relationship of the normalized RV to the PRV, was expressed as a radian between the RV and PRV vector computed as the inner product [11]. Therefore, SI ranges from -1 to +1. A value of 1.0 for the SI suggests that the test participant’s RV showed an identical pattern of sEMG activity across muscles to the neurologically intact group PRV for that task regardless of the EMG magnitude for those muscles [14]. The voluntary response index (VRI) value was computed separately for each maneuver. The VRI contains an element relatively independent of absolute amplitude that is SI. The second element is based on the magnitude of the RV that is an absolute measure of sEMG. These two elements are included in the VRI based on the significance of relative distribution and absolute level of activity [11].
The sEMG signals were digitized at a rate of samples per second (s/s) per channel with 12-bit accuracy using the WINDAQ data acquisition system version 2.91 (DATAQ Instruments Inc., Akron, OH, USA).
Ultrasonography
The ultrasound system with a 9–15 MHz linear transducer (GE LOGIQ E9; General Electrical Healthcare, China) was used for ultrasound measurements. The subjects were asked to lie prone with their feet hanging from the edge of the examination table and maintain the ankle joint in an anatomically neutral position (0°=perpendicular angle between the shank and the foot). Ultrasonography was conducted at the fixed point of the medial GCM, in the middle of two reference points. One of the reference points was at the proximal one-third of a longitudinal line from midway between the medial and lateral malleoli to midway between the medial and lateral epicondyles. The other point was at the medial end on a transverse line perpendicular to the point on the longitudinal line [15]. The muscle architecture was measured using electronic calipers in real-time B-mode ultrasonography. Muscle thickness was defined as the shortest distance between the superficial and deeper border of the muscle in the transverse view. The muscle fascicle length was defined as the length of hyperechoic inclined line between the superficial and deeper aponeurosis in the longitudinal view [16]. The fascicle pennation angle was defined as the angle between the muscle fascicle and the deeper aponeurosis in the longitudinal view [16] (Fig. 1).

Ultrasonographic images of medial gastrocnemius muscle of patient with hemiplegic stroke. (A) Muscle thickness in the transverse view. (B) The muscle fascicle length and fascicle pennation angle in the longitudinal view.
The sonoelastography technique, described by Kesikburun et al. [17], was used. In the transverse plane, at least three compression-relaxation cycles were used to validate reproducible findings. Light repetitive compression was applied manually with the hand-held transducer by providing visual feedback from the quality bar indicator. The images were stored as cine loops in the memory of the ultrasound system. The recorded motion images were replayed to select the best representative image. The elastogram of the region of interest (ROI) was obtained according to the color-coded image of the ROI. The ROI was set to cover the entire medial GCM muscle, excluding its hyperechoic epimysium. The elasticity index is defined as a value ranging from 0.0 to 6.0, created by the reflected color distribution within the ROI. A higher value indicates ‘higher stiffness’ and ‘blue color’ is dominant (Fig. 2). If muscle movement or contraction was detected during measurement, scanning was discontinued. The ultrasonographic evaluation was conducted by a radiologist without knowledge of the results of clinical spasticity scores.

Sonoelastographic images of unaffected (A) and affected (B) medial gastrocnemius (GCN) muscle in the transverse plane. Elastogram is red to green color in the unaffected muscles and green to blue color in the spastic muscles. Elasticity index (E2) is higher in spastic muscles and lower in unaffected muscles.
Statistical analysis
We used Wilcoxon signed-rank test to compare the BMCA protocols between the post-stroke spastic group and the normal control group; the ultrasonography parameters between the hemiplegic leg and the unaffected leg. The correlation of the MAS and MTS category with ultrasonography parameters and sEMG activities was assessed using the Spearman correlation coefficient (r). We used multiple regression analysis to validate the accuracy of BMCA and sonoelastography in evaluating spasticity. The significance level was set at p<0.05. All statistical tests were conducted using SPSS version 18.0 (SPSS Inc., Chicago, IL, USA).
RESULTS
The mean age of patients was 59.6 years and that of the control group was 26.7 years. The patients’ mean duration from the stroke onset was 23 weeks (range, 4.2–90.1 weeks). Three out of 8 patients had experienced a hemorrhagic stroke, and 5 patients had experienced an ischemic stroke. Average MRC of hemiplegic ankle dorsiflexion and ankle plantarflexion was 2.25 and 2.63, respectively. The demographics and general characteristics of all participants are listed in Table 1.
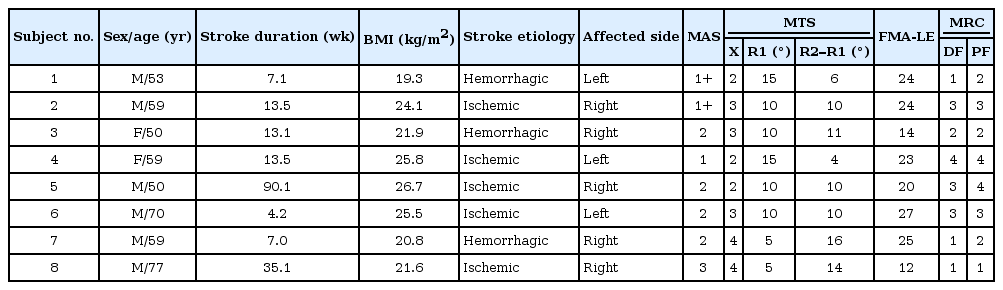
Demographics and general characteristics of the participants
The Brain Motor Control Assessment
The sEMG activity for voluntary ankle dorsiflexion of an stroke subjects was compared with a healthy subject (Fig. 3). Voluntary ankle movements in healthy subjects result in efficient reponses characterized by well-organized, low-level activation of a minimal number of muscles required for maneuvers, involving only movement against gravity (Fig. 3A). By contrast, the hemiplegic side of stroke subjects revealed generally increased muscle activity, that spread into many more channels, and with less movemet (Fig. 3B, 3C). The degree of coactivation greatly affected the movement observed during clinical examination.
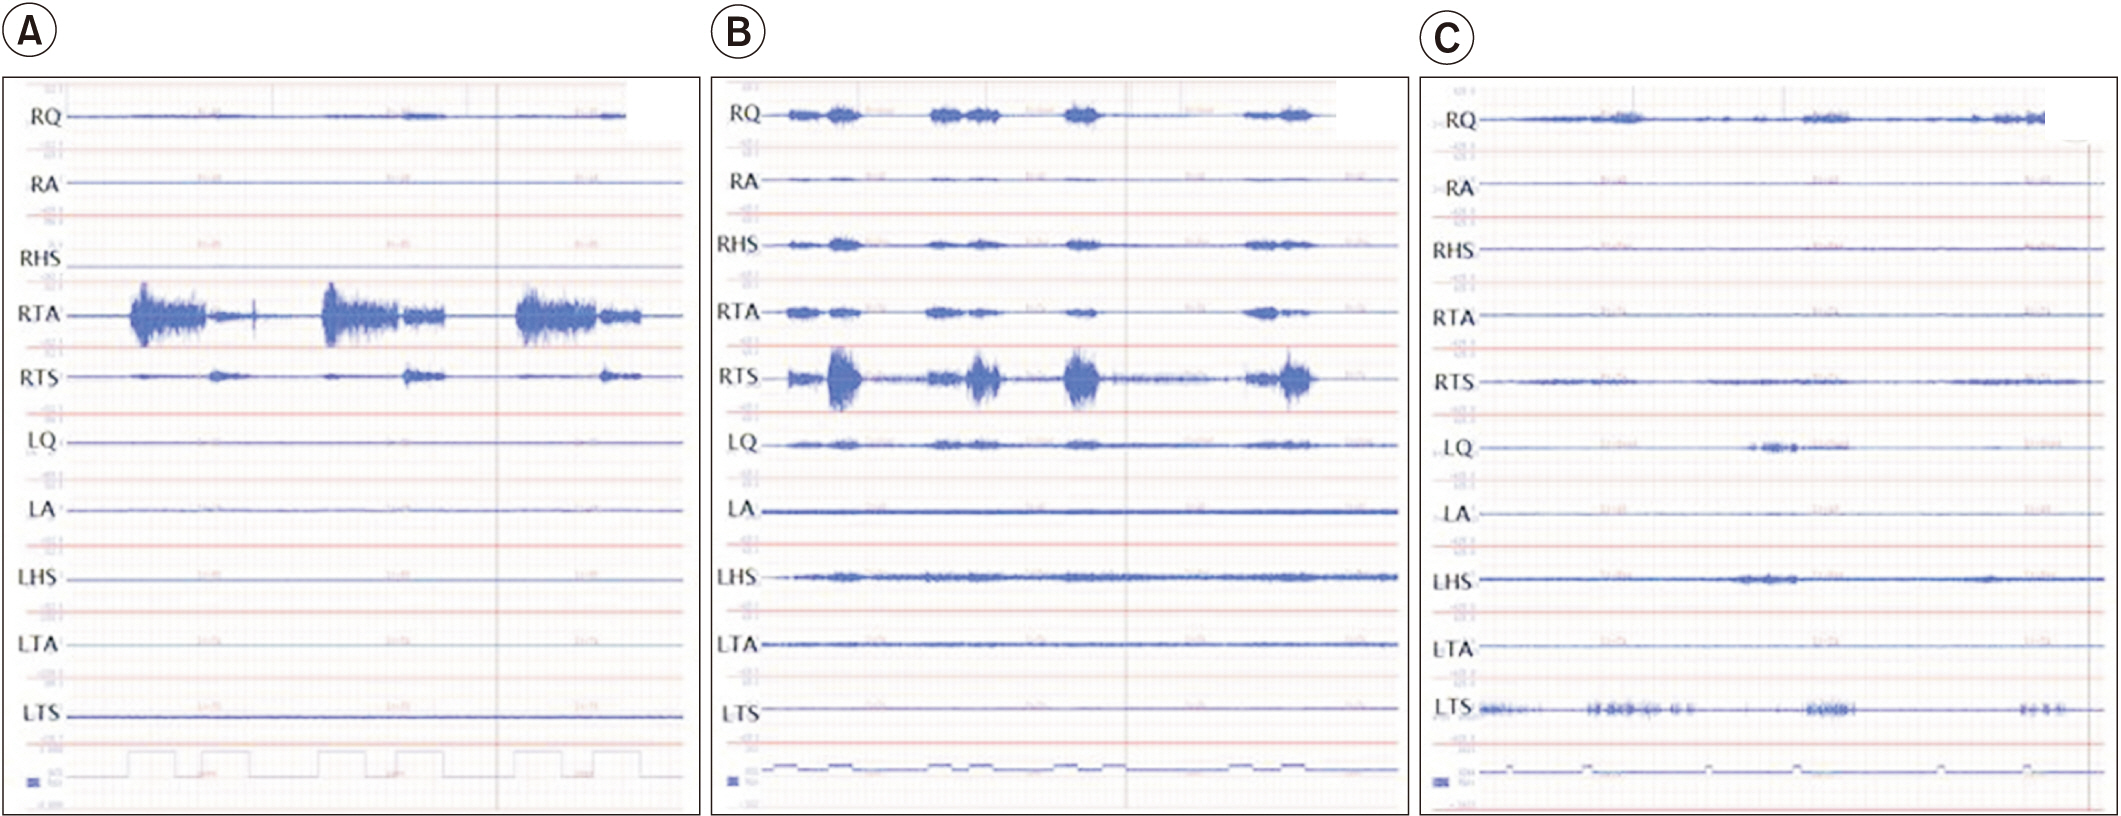
Voluntary control of movement. Examples of right ankle dorsiflexion attempts: (A) healthy subject and stroke subjects—subject no#7 (B) and subject no#8 (C). In (B), generally increased muscle activity spread across many channels, with less movemet. In (C), even though the subject made considerable effort, there was relatively little activity in both right tibialis anterior and triceps surae muscles, and only trace movement. RQ, right quadriceps; RQ, right hip adductor; RHS, right hamstring; RTA, right tibialis anterior; RTS, right triceps surae; LQ left quadriceps; RQ, left hip adductor; LHS, left hamstring; LTA, left tibialis anterior; RLS, left triceps surae muscle.
The VRIs for ankle dorsiflexion/plantarflexion were obtained from the control and stroke groups (Fig. 4). All SI values for these tasks were approximately 1.0 in the control group (SI=0.99 for ankle dorsiflexion; SI=0.94 for ankle plantarflexion), which suggests that all participants revealed a similar pattern of muscle activation during these tasks. In the stroke patient group, the mean value of SI was 0.14 for ankle dorsiflexion and the mean value of SI was 0.43 for ankle plantarflexion. The SI values were significantly lower in the stroke group compared with the control group for hemiplegic ankle dorsiflexion and plantarflexion (p=0.012 for ankle dorsiflexion; p=0.012 for ankle plantarflexion). The magnitudes of RV in sEMG were also lower in the stroke group when compared with the control group (63.07 μV vs. 105.43 μV for dorsiflexion; 48.24 μV vs. 58.21 μV for plantarflexion), without any significant difference (p=0.263 for ankle dorsiflexion; p=0.674 for ankle plantarflexion).

Voluntary response indices (VRIs) obtained from healthy control and stroke patients. (A) Ankle dorsiflexion of hemiplegic side. (B) Ankle plantarflexion of hemiplegic side. The VRI shows high similarity index (SI) values throughout all maneuvers for control group and a variable range of magnitude of response vector (RV). The SI values were significantly lower in the stroke group compared with the control group for hemiplegic ankle dorsiflexion and plantarflexion. The surface electromyography magnitudes were also lower in the stroke group, with no significant difference.
The averaged magnitudes of RV in sEMG revealed significant increases in the stroke group compared with the control group, with mean ALR values of 4.58 μV and 3.44 μV, respectively (p=0.036). Fig. 5 shows the relationship between RV elements averaged across the voluntary ankle movements and clinical spasticity measurement tools. These average sEMG activities of RV significantly increased corresponding to the MAS and MTS spasticity grade (X), and the difference between R1 and R2, defined as the dynamic component (R2–R1) (r=0.913 and p=0.001 for MAS; r=0.869 and p=0.005 for X-value; r=0.926 and p=0.002 for R2–R1 value) [18] (Fig. 5). PSFS and SFS showed no significant relationship with the sEMG activity.

The graph shows changes in magnitude of sEMG activity according the MAS category (A), MTS spasticity grade, X value (B) and MTS dynamic angle, R2–R1 (C). There was a significant relationship between the sEMG and clinical assessment tools (MAS, r=0.913 and p=0.001; X-value, r=0.869 and p=0.005; R2–R1 value, r=0.926 and p=0.002). The MAS scores were substituted by different grades: Grade 1 to 1, Grade 1+ to 2, Grade 2 to 3, Grade 3 to 4, and Grade 4 to 5. sEMG, surface electromyography; MAS, Modified Ashworth Scale; MTS, Modified Tardieu Scale.
Ultrasonographic evaluation
Table 2 shows the muscle architecture parameters measured using conventional B-mode ultrasonography and sonoelastographic data. The fascicle length and pennation angle were significantly decreased in the medial GCM on the hemiplegic side compared with the unaffected side (p=0.012 for fascicle length; p=0.012 for fascicle pennation angle). Muscle thickness on the hemiplegic side was lesser than on the unaffected side, without significant difference (p=0.173). The MAS and MTS showed no significant relationship with the difference in muscle architecture values between hemiplegic and unaffected sides.
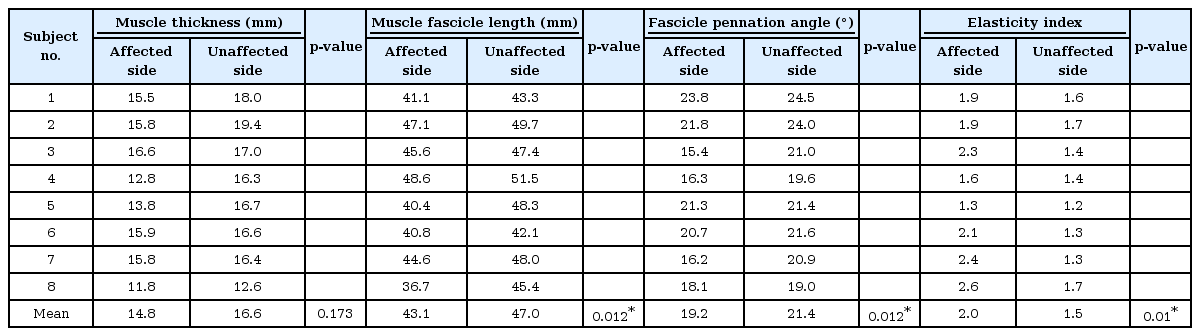
Muscle architecture and elasticity index of patients’ medial gastrocnemius muscle
The elasticity index of the spastic medial GCM was significantly increased compared with that of the muscle on the unaffected side (p=0.01). The MAS score was positively correlated with the elasticity index of the spastic GCM (r=0.371), without significant correlation (p= 0.228). The X and R2–R1 values were significantly correlated with the elasticity index in the hemiplegic GCM (r=0.913 and p=0.002 for X value; r=0.737 and p=0.037 for R2–R1 value) (Fig. 6). PSFS and SFS had no significant relationship with the elasticity index.

The graph shows changes in elasticity index according to the MAS category (A), MTS spasticity grade, X value (B), and MTS dynamic angle, R2–R1 (C). The MAS score was not significantly correlated with the elasticity index of the spastic GCM (r=0.371 and p=0.228). The X and R2-R1 values were significantly correlated with the elasticity index in the hemiplegic GCM (X value, r=0.913 and p=0.002; R2–R1 value, r=0.737 and p=0.037,). The MAS scores were substituted by grades: Grade 1 to 1, Grade 1+ to 2, Grade 2 to 3, Grade 3 to 4, and Grade 4 to 5. MAS, Modified Ashworth Scale; MTS, Modified Tardieu Scale; GCM, gastrocnemius muscle.
In the multiple regression analysis, the relationship between clinical evaluation tools and both BMCA and sonoelastography was linear (R2=0.905 for MAS; R2=0.847 for X value; R2=0.809 for R2–R1 value), without statistical significance.
DISCUSSION
Post-stroke spasticity is a common symptom after stroke, occurring in approximately 30% of patients [19]. Ankle plantarflexor spasticity was observed in approximately 66% of patients [20]. Calf muscle spasticity contributes considerably to disabilities affecting foot clearance during locomotion [21]. The ability to quantify spasticity is essential to the management of spasticity. Biomechanical measurements have been used to quantify spasticity for the last decade, and EMG is an electrophysiologic study used frequently [22]. Recently, an ultrasound-based method to evaluate spastic tissue was developed [23].
The BMCA protocol has been used to study spasticity and its underlying neural mechanisms, especially in spinal cord injured subjects [12,24]. To the best of our knowledge, until recently, the BMCA protocol had not been studied in hemiplegic stroke patients. In our study, the recorded muscle activity was significantly increased corresponding to the MAS and MTS in voluntary ankle movement of stroke patients. The features of EMGRMS activity seen in voluntary movement do not explain the relationship between individual muscles and magnitude of the sEMG activity, because VRI is based on the magnitude of the RV, which is an expression of the total activity during the movement. A specific SI value (Fig. 4) does not uniquely determine a single pattern [11]. Nevertheless, this does not devalue the SI, which relates patient’s motor control to that of neurologically healthy subjects. We only determined the voluntary movement segment of BMCA protocol and observed the movement pattern (Fig. 3) and the magnitude of activity (Fig. 5). However, McKay et al. [25] found a significant relationship between sEMG activity recorded during passive movements and MAS scores. We will investigate the relationship between another BMCA protocol and spasticity.
Real-time B-mode ultrasonography has been used to investigate muscle architecture of the medial GCM in UMN injured patients [16,26]. Gao et al. [27] reported that stroke survivors show a smaller pennation angle and fascicle length of the GCM than healthy subjects. The decreased pennation angle and fascicle length suggests higher fascicular tension that may be associated with the increased tone of calf muscles in stroke. Friden and Liber [28] found that spastic muscle cells had a decreased resting sarcomere length and nearly double the elastic modulus compared with normal muscle cells. As a result, spastic muscle cell is stiffer and shorter than the normal control group. The stiffness measured with sonoelastography revealed a significant difference between the hemiplegic and unaffected sides, without significant correlation between MAS and elasticity index of hemiplegic side. By contrast, the elasticity index revealed significance with MTS (X and R2–R1 value). Kesikburun et al. [17] conducted an assessment of sonoelastographic findings in the medial and lateral GCM of patients with stroke. The MAS scores of spastic GCM muscles reveal a weak positive correlation with sonoelastographic findings. In the study by Yasar et al. [29], Tardieu angle of finger flexors was negatively correlated with the elasticity index measured in the spastic finger flexors.
In this study, BMCA and sonoelastographic data revealed more significant difference in MTS than in MAS. Several studies compared MTS and MAS in the clinical evaluation of spasticity. Allison et al. [30] that the interrater reliability of the MAS scale for plantarflexor muscles was significantly lower than that of elbow flexor spasticity. The limited reliability of the MAS scale for testing of plantarflexor spasticity may be due to a shorter lever arm at the ankle, interfering with the determination of resistance during movement. The MAS seems to measure resistance adequately, without differentiating neural and peripheral contributions to resistance [31]. The MTS data collection procedure involves different stretching velocities to determine the velocity-dependent increase in spasticity during stretching. Therefore, the MTS measures spasticity based on Lance’s definition of spasticity [32].
We used BMCA protocol and ultrasonography in hemiplegic stroke patients to quantify ankle plantarflexor spasticity. The purpose of the BMCA protocol was to use neurophysiologic recording techniques to provide insight into the function of residual nervous system post injury that cannot be determined using current clinical assessment techniques. Clinically, ultrasonography is a popular tool for diagnosis and intervention. Sonoelastography is a dynamic study for detection of structural alterations in the spastic muscle in patients with stroke. Analysis of real time sonoelastographic images offers an objective index for estimation of color-coded graphic representation of relative stiffness of structures within the selected ROI [9]. The ultrasonography technique is associated with operator-dependent limitations and is associated with a learning curve. The technical problems with reproducing images in ultrasonography are attributed to the instability of the applied pressure using the freehand technique. In spasticity assessment, skeletal muscle ultrasound and BMCA protocol are critical tools for quantitative analysis of muscle architecture and function clinically. Spasticity involves multifactorial pathophysiology [33], with complex and diverse underlying mechanisms and predisposing factors. Understanding of the spasticity phenomenon is essential to facilitate the development of novel drugs and therapeutic strategies to efficiently treat causes rather than symptoms.
There are several limitations in this study. First, the sam ple size was limited to 8 stroke subjects. However, this study is meaningful as a pilot study. Second, most of the patients with only one exception had MAS scores ranging from 1 to 2; i.e., most patients belonged to the mild spasticity group. Third, the disease duration in participants revealed a wide range, which affected the spastic and elastic properties of the evaluated muscles. Fourth, the measurement of muscle architecture was based only on the medial GCM. Muscle fascicle lengths have been reported to vary in the medial and lateral GCM [16,34]. Therefore, it is possible that differences in lengthening behaviors exist. Further, the architectural parameters of a hemiplegic spastic leg were not compared with the neurologically intact group but with the unaffected side leg. Dias et al. [35] reported that there were no differences in muscle architecture or fascicle excursion by comparing the contralateral limb of stroke survivors with the healthy group.
Despite the limitation, significant conclusions were derived from these results. This study is the first of its kind in which BMCA protocol was applied to stroke patients. Ultrasonography was conducted concurrently, and therefore, it was possible to perform neurophysiological and pathophysiological assessments. Although BMCA and sonoelastographic data were statistically significant in MTS as individual variables, multiple regression analysis was not significant due to the small sample size and heterogeneous properties of the subjects. Therefore, prospective studies are required to overcome these limitations and provide a better predictive value of BMCA and ultrasonography parameters for spasticity assessment after stroke.
In conclusion, our study correlated MAS and MTS with muscle architecture, elasticity and sEMG activities for quantitative spasticity evaluation. The clinician should adopt appropriate evaluation method based on the patient features and the study goals. A large-scale and longterm follow-up study is necessary to determine the effectiveness and efficiency of the new quantitative evaluation method of spasticity.
Notes
CONFLICT OF INTEREST No potential conflict of interest relevant to this article was reported.