Diffusion Tensor Tractography in Two Cases of Kernohan-Woltman Notch Phenomenon
Article information
Abstract
Kernohan-Woltman notch phenomenon (KWP) is an ipsilateral motor weakness due to compression of the contralateral cerebral peduncle. We report two cases of KWP following traumatic brain injury. In case 1, ipsilateral hemiplegia was noted after right subdural hemorrhage. Although magnetic resonance imaging showed no abnormal signal changes on cerebral peduncle, diffusion tensor tractography (DTT) revealed interruption of corticospinal tract (CST) at lower level of the midbrain level. In case 2, there was abnormal signal change of the right cerebral peduncle contralateral to the primary lesion and we could not reconstruct right CST. Case 1 showed unsatisfactory motor recovery even after 15 months, and follow-up DTT showed no change. In case 2, follow-up DTT was not performed, but her ipsilateral hemiparesis had almost disappeared during the 15 months. DTT would be useful in detecting ipsilateral hemiparesis due to KWP and the clinical course may differ according to the lesion characteristics.
INTRODUCTION
Paradoxical hemiparesis is relatively rare and can be caused by several conditions, such as primary brain stem lesion or contralateral contusion [1]. Kernohan-Woltman notch phenomenon (KWP) is defined as an ipsilateral motor weakness due to compression of the contralateral cerebral peduncle, which is usually observed in patients with advanced brain tumor or severe head injury. Kernohan and Woltman first described the compression of the crus cerebri against the edge of the tentorium caused by a contralateral mass in 1929 [2]. Because KWP shows 'false localizing sign', the clinician may have difficulty in correlating the neurological examination with the appropriate location of the lesion.
Conventional brain imaging techniques, such as magnetic resonance imaging (MRI) or computed tomography (CT) have limitations in the diagnosis of KWP because these techniques cannot clearly visualize the corticospinal tract (CST). Diffusion tensor image (DTI) with fiber tracking methods has been reported to be useful in visualizing the CST and related lesions. Recently, several studies reported that diffusion tensor tractography (DTT) is a useful tool to diagnose KWP [3,4]. However, there are few studies regarding the long-term recovery and correlation with DTI in KWP patients. In this study, we report the clinical characteristics, DTT findings, and long-term functional changes in two cases of KWP following traumatic brain injury.
CASE REPORTS
Case 1
A 67-year-old man was admitted to the emergency room after an assault. The patient showed altered mentality and initial Glasgow Coma Scale was 3/15. Initial brain CT scan showed an acute frontotemporoparietal subdural hemorrhage (SDH) on the right side (Fig. 1). An emergent craniectomy and hematoma removal was done. After the operation, his cognitive function gradually improved to a Rancho Los Amigos level of function V. However, increased spasticity and weakness of muscles were noted on the right side: Motor grade, 2/5; Fugl-Meyer assessment, upper 6+lower 10=16/100; Manual Function Test, right 0/32. MRI was taken 5 days after injury. However, there were no abnormal signal changes on the cortical and subcortical areas of the left hemisphere or brainstem including the cerebral peduncle (Fig. 1). Nonetheless, his paradoxical ipsilateral motor weakness persisted.

(A) Brain computed tomography at the onset of injury in case 1. The images show massive subdural hemorrhage on the right frontotemporal lobe with uncal herniation to the left causing compression of the cerebral peduncle against the tentorial egde (arrows). (B) The T1- and (C) T2-weighted axial magnetic resonance (MR) images 5 days after injury. (D) T1-weighted coronal MR images 5 days after injury. The uncal herniation improved after surgery but the images showed mild shifting of cerebral peduncle to the left tentorial edge (arrow heads). There were no abnormal signal changes on MR images.
DTI images were obtained 4 weeks after onset of the injury. DTI was acquired using a 3.0-T Philips Gyroscan Intera MRI scanner (Philips Healthcare, Best, The Netherlands) with a six-channel phased array sensitivity encoding (SENSE) head coil. Images were obtained based on the single-shot echo-planar image sequence. The DTI data parameters were as follows: field of view 224×224 mm2; matrix 112×112; repetition time (TR)=9,131 ms; echo time (TE)=85 ms; slice thickness=2 mm; SENSE factor=2; and b=1000 s/mm2. We obtained 70-75 gapless, contiguous transverse images with each of 32 noncollinear diffusion-sensitizing gradients.
Fiber tracking was analyzed using the "FiberTrak" package included in the Extended MR Workspace R 2.6.3.1 software (Philips Healthcare). The setting parameters for the tractography were as follows: minimum fractional anisotropy (FA)=0.15; maximum angle change=30°; minimum fiber length=10 mm. Two regions of interests (ROI) were selected to reconstruct the CST. One ROI was placed on the CST portion of the anterior lower pons and the other was placed on the CST portion of the anterior mid pons.
In the fiber tracking with the DTI image, constructed fibers passed through the CST. However, disruption of fibers was observed around the left pons. The FA and apparent diffusion coefficient (ADC) values were obtained from posterior limb of internal capsule (PLIC), cerebral peduncle, and anterior pons of both hemispheres (Table 1). The FA values of the left cerebral peduncle and anterior pons were decreased compared to those of the contralateral side. The DTI images were obtained again 9 months after the onset of injury, and previously disrupted fibers were unchanged (Fig. 2). FA values of cerebral peduncle and pons on the affected side were increased, while there was no significant difference in the relative decrease of the previously acquired FA value on the left side. ADC values of the left hemisphere were similar or slightly higher than those of the right hemisphere in initial and follow-up images (Table 1). At 15 months post-injury, he was able to ambulate with a quad-cane under supervision, but was unable to grasp and release freely: Fugl-Meyer assessment, upper 24+lower 8=32/100; Manual Function Test, right 4/32.
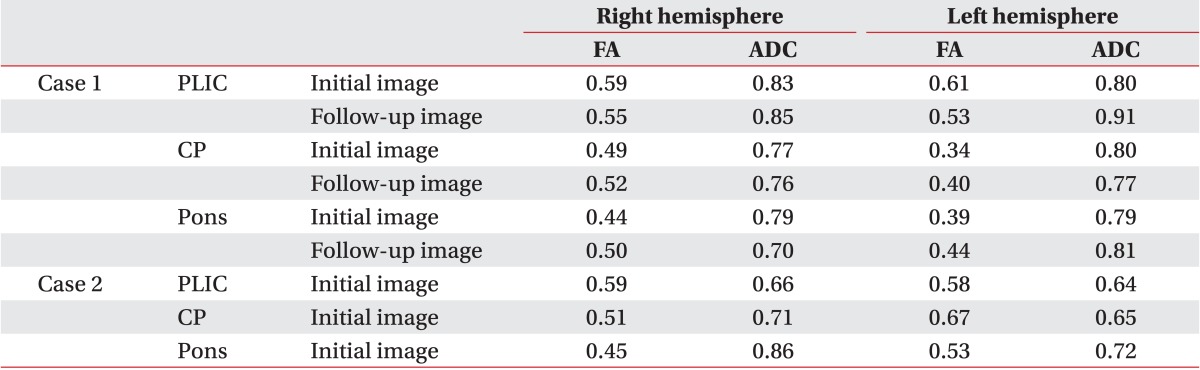
Comparison of values for fractional anisotropy and apparent diffusion coefficient in the initial and follow-up images
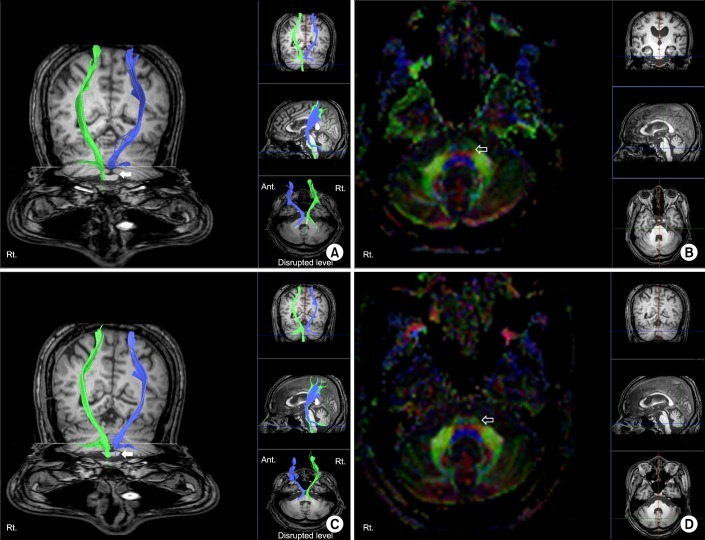
(A) Diffusion tensor image with tractography for the corticospinal tract and (B) axial image of the fractional anisotropy (FA) color map 4 weeks after the onset of injury. (C) Follow-up tractography and (D) axial image of FA color map 9 months after the onset of injury (left hemisphere, blue; right hemisphere, green). Disruptions of corticospinal tract around the left pons were noted in initial and follow-up images (arrows). FA color map showed disrupted blue fibers in the left anterior pons compared with the right side (open arrows).
Case 2
A 25-year-old woman presented to our hospital after being assaulted. Initial Glasgow Coma Scale was 10/15. Initial CT scan revealed a large amount of acute left frontotemporoparietal SDH and frontal intracranial hemorrhage with uncal herniation to the right. An emergent craniectomy and hematoma removal was performed (Fig. 3). Physical examination showed left side hemiparesis: Motor grade, 2/5; Fugl-Meyer assessment, upper 8+lower 12=20/100; Manual Function Test, left 16/32. After the operation, her cognitive function coincided with a Rancho Los Amigos level of function VI. MRI was obtained 10 days after injury to find the cause of the ipsilateral motor weakness, and abnormal signal change of the right cerebral peduncle contralateral to the primary lesion was detected. The round-shaped region of decreased intensity in the right crus cerebri on T1-weighted images and high signal intensity on T2-weighted images were observed (Fig. 3). DTI scanning was performed 8 weeks after injury using the same protocol as stated in case 1.

(A) Brain computed tomography at the onset of injury in case 2. The images show a large amount of left frontotemporal subdural hemorrhage, frontal intracranial hemorrhage, and contralateral shift of midline and transtentorial herniation (arrows). (B) The T1- and (C) T2-weighted axial magnetic resoance images 10 days after injury. Low intensity signal change in the right crus cerebri on T1-weighted image, and high signal intensity change on T2-weighted image (arrow heads).
DTT did not reconstruct right CST around the midbrain due to the lower level of lesion in the T1-weighted image. Also, the CST from the cerebral cortex to the PLIC was not reconstructed. However, CST disrupted in the midbrain level was reconstructed after using different ROI method: one ROI was placed on the CST portion of the anterior lower pons and the other was placed on the CST portion of PLIC (Fig. 4). The FA and ADC values were obtained segmentally as in case 1 on both sides (Table 1). Decreased FA value and increased ADC value were noted on the right cerebral peduncle and anterior pons area compared to those on the left side. Four weeks after rehabilitation program, she was independent in ambulation and the motor weakness was improved: Motor grade 3/5. Her cognitive function improved to level VII with Rancho Los Amigos Scale. We re-evaluated the functional status 15 months after the onset of injury. The patient showed gradual improvement of functional abilities. She was able to grasp and release small objects and to ambulate independently: Fugl-Meyer assessment, upper 58+lower 31=89/100; Manual Function Test, left 30/32. However, we could not obtain a follow-up DTI because the patient refused the evaluation.

(A) Diffusion tensor image with tractography (DTT) for the corticospinal tract (CST) 8 weeks after the onset of injury in case 2 (left hemisphere, blue). Although tentorial herniation caused brain stem damage in Kernohan-Woltman notch phenomenon, right CST tract was also not visualized from cerebral cortex to posterior limb of internal capsule (PLIC) after reconstruction, which was not the case in DTT image of case 1. (B) CST was reconstructed after using different region of interest (ROI) method. One ROI was placed on the CST portion of the anterior mid pons and the other was placed on the CST portion of PLIC (left hemisphere, blue; right hemisphere, green). Disruption of CST around midbrain level was noted (arrow).
DISCUSSION
Paradoxical ipsilateral hemiparesis may develop as a result of compressive injury of the cerebral peduncle against the edge of the tentorium. The notching of the anterolateral cerebral peduncle with resulting tissue destruction causes ipsilateral hemiparesis to the mass lesion, thereby damaging the descending CST in the contralateral cerebral peduncle [1]. Along with acute traumatic brain injury, it is important to differentiate KWP from other possible ipsilateral hemiparesis, such as primary brain stem lesion, contralateral contusion, pressure necrosis secondary to an elevated intracranial pressure, and arterial infarction [5,6].
Diagnosis of KWP is challenging. In previous studies [7,8], a lesion associated with KWP was observed as a round rim-shaped area in the anterolateral midbrain region in traumatic brain injury patients due to transtentorial herniation. The lesion usually revealed hypointense signal on T1 and hyperintense signal on T2 MR images; however, this lesion is not always observed in conventional brain imaging, as in case 1. DTT is a recently developed functional imaging technique and may be a useful tool for determining the disrupted area of CST. Several studies reported injury of the CST caused by transtentorial herniation or KWP, and they suggested the usefulness of DTT in diagnosis and evaluation of severity of CST disruption [3,4,9].
In case 1, the previously documented signal changes on the cerebral peduncle were not observed in conventional MRI. Nevertheless, case 1 had suffered from persistent ipsilateral motor weakness and spasticity. On the initial DTT, disruption of the CST was observed around the left pons area. Disrupted fibers on DTT implied damage in the left anterior pons area and cerebral peduncle because the FA values of these areas were decreased compared with those of the right side. The follow-up DTT did not show any remarkable changes, and his motor function had not improved even at 15 months post-injury. Furthermore, the spasticity of wrist and elbow flexor muscles on the affected side was evaluated as Modified Ashworth Scale 2. This is another consideration of the relatively unsatisfactory functional improvement. In case 2, the left SDH and frontal hemorrhage caused midline shift and transtentorial herniation at the right midbrain. On the T1 image of brain MR, right cerebral peduncle hypointensity was detected and the DTT showed no observable CST fibers by the commonly used ROI method. In addition, the decreased FA values of the cerebral peduncle and anterior pons of the right hemisphere compared with the contralateral side represent the damage to these areas. We predicted that recovery of motor function would be poor. However, unexpectedly, she showed excellent motor improvement and achieved almost full functional recovery. This may have been caused by alleviation of tissue swelling around the brainstem. We tried to reconstruct the CST using other ROI, such as primary motor cortex and PLIC. This allowed reconstruction of some fibers of CST, but it was disconnected around the midbrain level. We expected to find the CST reconstructed and the integrity restored on follow-up DTT image; unfortunately, we were unable to perform the follow-up evaluation and therefore could not confirm our hypothesis.
Long-term functional outcome in KWP is not well understood yet. In this report, the two cases showed quite different clinical recovery patterns during the 15-month follow-up period. In case 1, the motor recovery was limited and it was correlated with disrupted CST in the two serial DTT studies. In contrast, case 2 showed good recovery despite non-visualization of CST in the initial DTT study. Thus a single DTT study is insufficient to predict the outcome of motor recovery. The clinical course may differ according to the neuronal loss. Serial DTT studies may provide more information regarding the relationships between functional changes and neuroimaging findings in KWP.
In conclusion, we suggest that DTT may be a useful method to diagnose underlying neural injury mechanism in KWP following traumatic brain injury. Also, the long-term recovery pattern varied in our two cases, and despite the methodological short-comings, DTT may provide more information to predict functional recovery.
ACKNOWLEDGMENTS
This study was supported by a Korea University Grant.
Notes
No potential conflict of interest relevant to this article was reported.