The Clinical Significance of the Mini-Nutritional Assessment and the Scored Patient-Generated Subjective Global Assessment in Elderly Patients With Stroke
Article information
Abstract
Objective
To evaluate the clinical usefulness of the subjective assessments of nutritional status (Mini-Nutritional Assessment [MNA] and scored patient-generated subjective global assessment [PG-SGA]), compared with the objective (hematological, biochemical, and anthropometric) assessments, and to identify the correlation between the MNA and the scored PG-SGA in elderly patients with stroke.
Methods
Thirty-five stroke patients, aged 60 to 89 years old, participated in our study. The MNA, the scored PG-SGA and objective factors were evaluated. The objective malnutrition state was defined based on laboratory outcomes. According to the MNA and the scored PG-SGA classifications, total patients were respectively divided into three groups; well-nourished (W), at risk of malnutrition (R), and malnourished (M), and into four groups; normally nourished (A), suspected or mildly malnourished (B), moderately malnourished (C), and severely malnourished (D).
Results
Mean age and body mass index of subjects were 70.6 years and 22.2 kg/m2, respectively. Twenty-six (74.3%) patients were identified to be at an objectively malnourished state. In MNA, 3 (8.6%) patients were classified as group W, 13 (37.1%) as R, and 19 (54.3%) as M. Total MNA scores and three categorization had mild correlation with objective grouping (r=0.383, r=0.350, p<0.05, respectively). Restructuring into two groups by combining group R and M made strong correlation (r=0.520, p<0.01). On the basis of scored PG-SGA, 6 (17.1%) patients were sorted as group A, 10 (28.6%) as B, 15 (42.9%) as C, and 4 (11.4%) as D, respectively. Total scores and the grouping into four indicated meaningful correlation with the objective distinction (r=-0.403, p<0.05, r=0.449, p<0.01, respectively). There was a significant correlation between the MNA scores and the PG-SGA scores (r=-0.651, p<0.01).
Conclusion
It is proposed that the MNA and the scored PG-SGA would be useful in screening malnourished elderly patients with stroke.
INTRODUCTION
The good nutrition has been considered as a fundamental factor for successful recovery in geriatric patients. However, malnutrition seems to be easily induced in the elderly patients with stroke due to multifactorial reasons. In a systematic review, being in a malnourished state has been reported to be aggravated in the presence of dysphagia following stroke [1]. Cognitive impairment or dysphasia has also been shown to foster the unexpressive self-report regarding nutritional state, which would cover up malnutrition. Loss of appetite and dependent eating process could also worsen the malnourished state. Individualized nutritional treatment strategy can improve the quality of life in elderly patients with stroke [2].
To implement proper treatments, evaluating individual's nutritional state would be necessary. Nutritional evaluation could be grossly divided into two groups, the objective and the subjective one. The former includes hematological, biochemical, and anthropometric evaluation. The representatives in the latter entail the Mini-Nutritional Assessment (MNA) and the scored patient-generated subjective global assessment (PG-SGA).
The MNA consists of a three-step process: screening, assessment, and the total assessment. Screening test contains six questions: intake, weight loss, mobility, disease, neuropsychological problem, and body mass index (BMI). A patient, who scores 12 to 14 points, would be considered to be in a normal nutritional state. However, those who score less than 11 would be regarded as malnourished, and implementation of further assessment would be necessary. In assessment process, twelve questions about health conditions and type of meals would be assessed. After that, inquirer could aggregate total units. Typically, subjects are categorized into three groups according to the outcome: normal group (24 to 30 points), group at risk of malnutrition (17 to 23.5 points), and malnourished group (0 to 16.5 points).
The scored PG-SGA consists of total PG-SGA score and global assessment. Total PG-SGA score is sum of scores resulting from 7 questions about weight loss, food intake, symptoms, activities, disease, metabolic demand, and physical examination. Four subgroups are generally offered according to the score. The normal group, who need no intervention, should show 0 to 1 point. Patients with 2 to 3 points should be considered as suspected or mildly malnourished group. Patient and family education should be required by a clinician with pharmacologic intervention. Score of 4 to 8 points demands the intervention by a dietitian with clinical symptom survey. Points above 8 indicate critical need for improved symptom management and nutrient intervention.
This study evaluated the clinical significance of the subjective assessment of nutritional state (the MNA and the scored PG-SGA) in comparison with the objective (hematological, biochemical, and anthropometric) assessment. Furthermore, the correlation between the MNA and the scored PG-SGA was also analyzed. We sought to explore the usefulness of those subjective assessments of nutritional state. Many sanatoriums and local long-term care hospitals have difficulties in performing frequent laboratory tests, which are necessary to identify malnourished patients, because these care institutions face constraints like the lack of facilities and economic burden. Therefore, subjective assessments about nutrition could be useful methods for them.
MATERIALS AND METHODS
Subjects
Thirty-five patients with stroke, 60 to 89 years old, admitted to our hospital in February and March 2010 were evaluated. Twenty patients were male and fifteen were female. They had stable vital signs and were in the chronic post stroke stage (Table 1). Five patients had dysphagia, which made four of them to acquire tube feeding and the others to use thickeners when drinking liquid.

Basic characteristics of subjects
To be eligible in this study, all patients or caregivers were required to provide detailed report on nutritional status after stroke. All subjects provided informed consent for the participation in this study.
Methods
Objective nutritional factors and subjective ones (the MNA, and the scored PG-SGA) in elderly patients with stroke were evaluated. The objective malnutrition state was classified on the basis of laboratory outcomes. Hematological and biochemical parameters included total protein, albumin, electrolytes, cholesterol, white blood cell, hemoglobin, total lymphocyte, transferrin, vitamin B12, and folic acid. Anthropometric factors covered circumferences of mid arm and calf, triceps skin fold thickness, and BMI. Normal range values for the above factors are described in Table 2. Any patient who showed at least one abnormal finding was regarded as being objectively malnourished.

Mean values of subjects and correlation analysis in laboratory parameters
Total MNA scores and total PG-SGA scores were also calculated. According to the MNA and the scored PG-SGA classifications, all patients were respectively categorized, into three groups (well-nourished [W], at risk of malnutrition [R], and malnourished [M]), and into four groups (normally nourished [A], suspected or mildly malnourished [B], moderately malnourished [C], and severely malnourished [D]). Although as a part of the scored PG-SGA, the global assessment, which should be assessed by a clinician, was excluded in this study because this study needed subjective evaluation tools, which are easily available at home or long-term care facilities.
Furthermore, we combined the above mentioned groups into two respective groups in order to find a more relative and concisely modified assortment. The degrees of the relationship among these factors and groups were statistically evaluated through the correlation and regression analyses, using SPSS ver. 17.0 (SPSS Inc., Chicago, IL, USA). The status of whether being in objectively normal or abnormal state was converted into dummy variables. The dependent variables of the MNA and the scored PG-SGA grouping were converted into ordinal scales. In detail, the correlation between three groups in the MNA and objective factors, the correlation between four groups in the scored PG-SGA and objective factors were also analyzed (Table 2). A contingency table was used to determine the positive and negative predictive value, sensitivity, and specificity. Statistical significance was reported at the conventional p<0.05 level (two-tailed).
RESULTS
Mean age and BMI of subjects were 70.63±7.23 years and 22.18±3.02 kg/m2, respectively. Twenty-six (74.3%) patients were identified to be at an objectively malnourished state (Table 3).

Sub-grouping in various ways and their correlation
In the MNA, 3 (8.6%) patients were classified as group W, 13 (37.1%) patients as R, and 19 (54.3%) patients as M, respectively. Total MNA scores and initial three groups categorization had a mild correlation with objective grouping (r=0.383, r=0.350, p<0.05, respectively). Re-categorizing into two new groups by combining groups R and M yielded a stronger correlation with objective grouping (r=0.520, p<0.01), when compared to merging group W and R. Based on this grouping, sensitivity of the MNA was found to be 100%, specificity was 33.3%, positive predictive power was 81.2%, and negative predictive power was 100%, respectively.
Based on the scored PG-SGA, 6 (17.1%) patients formed group A, 10 (28.6%) patients were categorized as group B, 15 (42.9%) patients were defined as group C, and 4 (11.4%) patients formed group D. Total scores and ordinal scale converted from original four groups indicated a meaningful correlation with objective distinction (r=-0.403, p<0.05, r=0.449, p<0.01, respectively). When grouped into nutritionally normal and abnormal group, the sensitivity of the scored PG-SGA was 92.3%, specificity was 44.4%, positive predictive power was 82.7%, and negative predictive power was 66.6%, respectively. There was a significant correlation between the MNA and the scored PG-SGA values (r=-0.651, p<0.01). Total scores from individual patients in the MNA and the scored PG-SGA are indicated in Fig. 1. Typically, 42.3% of variance in the MNA obtained through regression analysis could be explained by the scored PG-SGA. The regression equation was established as, the scored PG-SGA score=-0.458×the MNA score+12.030 (r2=0.423, p<0.05).
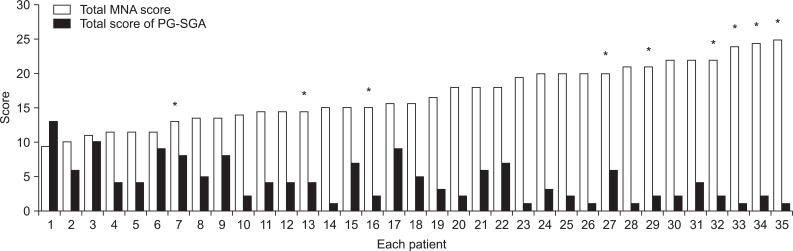
Results of nutritional assessment. MNA, Mini Nutritional Assessment; PG-SGA, Patient-Generated Subjective Global Assessment. *Objectively malnourished patient.
Moreover, a relatively weak connection was observed when grouping into two parts (nutritionally normal and abnormal) was done, respectively in the MNA and the scored PG-SGA (r=0.402, p<0.05). In the objective evaluation, white blood cell count, BMI, circumferences of mid arm and calf showed meaningful correlation with the MNA scores. On the other hand, albumin, total cholesterol, male hemoglobin, total lymphocytes and circumferences of mid arm were found to be in correlation with the PG-SGA scores. All four patients, who got tube feeding, were assessed to be in the state of malnutrition by the MNA. However, two of them were revealed as malnourished by the objective evaluation. On the other hand, based on scored PG-SGA, only one patient amongst them was considered to be severely malnourished.
DISCUSSION
Despite numerous previous nutritional evaluations of geriatric patients, it is still difficult and controversial to define the optimal evaluation method for assessment of nutritional state amongst the hematologic, biochemical, anthropometric, and subjective assessments. Therefore, in the present study, we focused on the correlation between the objective and subjective evaluation, and tried to find the clinical significance of the MNA and the scored PG-SGA in Korean elderly patients with stroke.
In the hematologic evaluation, the results were distinguishable from that of a previous study in Korea, which reported only hemoglobin to be correlated with the MNA score in geriatric patients with stroke [3]. In the result of the present study, six patients showed low albumin level (below 3.5 g/dL). Furthermore, amongst them, only three patients presented abnormally low transferrin level, which was revealed to have no correlation with either the MNA score or the scored PG-SGA. The result provides contradictory ideas considering the fact that serum transferrin, due to its short half life [4], is a more sensitive factor for protein depletion than albumin. This might be caused by the fact that in iron deficiency anemia, the level of transferrin could be elevated [5]. The small sample size also could be one of the reasons which could have generated the contradictory result. Furthermore, more items could be revealed as being correlated with subjective evaluations, if we had converted laboratory results into ordinal scales with reasonable intervals, because dependent variables of hematologic factors were not normally distributed between zero value and the point below normal.
Although circumferences of mid arm and calf presented themselves as meaningful elements for nutritional assessment in this study, they are still open to dispute. For normal geriatric population, low calf circumference and low mid arm circumference were effective in predicting follow-up nutritional risk [6]. Generally, patients with hemiparesis show remarkable difference in the circumference of both extremities, depending on the time, their activities, or positions. In the case of patients with quadriparesis, edema in both extremities could be easily observed. Therefore, it may be inaccurate to measure exact muscle mass using rulers in patients with stroke.
An evaluation of nutritional state in patients with stroke is worthwhile despite all the difficulties. Well-nourished patients demonstrated better diet quality and better quality of life [7]. In a longitudinal cohort study, older men who lost weight, total lean mass, or total fat mass had a higher risk of mortality than men who remained in a stable condition [8]. Malnutrition after an acute stroke is associated with poor outcomes including increased length of hospital stay and complications [9].
The MNA is considered as one of the most useful tools to screen the state of malnutrition in the normal geriatric subjects. However, in the case of patients with stroke, the method is associated with certain limitations. Most of the patients with stroke exhibited reduced mobility and polypharmacy, which might be one of the reasons that induced high sensitivity and relatively low specificity in the MNA. Excessive polypharmacy is correlated with the decline in nutritional status, functional ability and cognitive capacity in geriatrics. However, the changes in nutrition, physical functionality and cognition could not be easily predicted by polypharmacy status [10]. In cases of patients who acquired tube feeding, total assessment score of the MNA might be higher, because item K and item L should be marked as 0 point, respectively. However, in the scored PG-SGA, tube feeding state earned 0 point, which is regarded as a positive factor. So, they could be regarded as malnourished frequently in the MNA when compared to the state in the scored PG-SGA [11]. The scored PG-SGA seems to be a detailed nutrition assessment tool that allows relatively quick identification of malnourished stroke patients [7]. The scored PG-SGA has merits in providing various records of gastrointestinal symptoms, which could be helpful for further evaluation. Furthermore, it reflects the symptoms during the past two weeks and the status of food intake during the past month. Because of its detailed sub items and survey for relatively short period when compared to the MNA, the scored PG-SGA may be more sensitive for the small changes after the nutritional intervention. However, to testify this presumption, further evaluation should be performed. This study has limitations like, we could not identify the exact period of malnutrition and individual examinations were executed only once. Consequently, further research with serial follow-up would be expected to reveal the sensitivity and the specificity of those subjective assessments according to the period of malnutrition.
In conclusion, it is proposed that the MNA and the scored PG-SGA would be effective tools in screening malnourished elderly stroke patients. Their correlation allows the score of one to be roughly presumed by the other. This study extends a cautious suggestion that nutritionally risky group (R) can be considered as malnourished among patients evaluated with the MNA. Further studies are expected to follow-up evaluation after nutritional intervention.
Notes
No potential conflict of interest relevant to this article was reported.