Dose-Related Effect of Extracorporeal Shock Wave Therapy for Plantar Fasciitis
Article information
Abstract
Objective
To examine the dose-related effect of extracorporeal shock wave therapy (ESWT) for plantar fasciitis.
Methods
Sixty patients with plantar fasciitis despite conservative treatment were enrolled. The patients were divided into a low-energy group (group L: n=30, 1,000 shocks/session, energy flux density [EFD] per shock 0.08 mJ/mm2) and a medium-energy group (group M: n=30, 1,000 shocks/session, EFD 0.16 mJ/mm2). The main outcome measures were visual analogue scale (VAS), Roles and Maudsley (RM) score, and thickness of plantar fascia (PF). To compare the effects between each group, follow-up was carried out 1 week after 3 and 6 sessions, and 1 and 3 months after ESWT.
Results
Significant VAS and RM score improvement, and PF thickness reduction were observed in both groups (p<0.01). After 3 sessions of ESWT, group M showed significant improvement in the VAS and RM score than group L, whereas after 3 additional sessions applied in group L, the main outcomes were no longer significantly different in both groups (p>0.05).
Conclusion
Therapeutic effect might disclose a dose-related relationship; therefore, EFD and the times of the session are considerable factors when treating with ESWT.
INTRODUCTION
The plantar fascia originates on the inferior side of the calcaneus and is attached to the plantar plate of the metatarsophalangeal joint and the base of the proximal phalanx of the toe. It is important in maintaining the medial longitudinal arch and in absorbing shocks, and is also involved in the windlass mechanism during walking [1,2]. When excessive loads are repeatedly applied to the plantar fascia, acute or chronic inflammatory changes occur in the calcaneus insertion, leading to the development of plantar fasciitis [1,3-6]. Plantar fasciitis is the most common cause of heel pain. Cole et al. [7] reported that plantar fasciitis is a common condition that occurs in about 10% of the American population.
Generally, pain is aggravated when a patient with plantar fasciitis takes their first steps in the morning but gradually improves with activity. Another characteristic of the condition is the experience of tenderness when pressure is applied to the medial calcaneus on which the plantar fascia originates. Also, when the toes are dorsiflexed, the plantar fascia contracts, and pain increases [3,8,9]. While the precise cause of plantar fasciitis is unknown, it is associated with obesity, middle age, flat foot, and pes cavus [7].
Treatment methods for plantar fasciitis are diverse, including medication, physical therapy such as stretching exercises, non-surgical treatments such as insole, night splint, and local steroid injection, and surgical treatments such as plantar fascia release. However, the results of the treatment were not consistent [7,10].
Recently, many researchers have demonstrated the effects of extracorporeal shock wave therapy (ESWT) on chronic plantar fasciitis that has previously been resistant to conservative treatment. Their studies have shown that ultrasonography not only alleviates subjective pain but also changes the thickness of the plantar fascia [11-15]. While a number of papers have reported the mechanism and effects of ESWT on plantar fasciitis, no treatment protocol for ESWT has been established. Particularly, much controversy exists regarding the proper amount of energy to be applied to the affected tissue.
Our aim in this study was therefore to investigate the dose-related effect of shock wave therapy at different total energy influx by adjusting the times of sessions and energy flux density (EFD) in patients with chronic plantar fasciitis.
MATERIALS AND METHODS
Subjects
All patients who had unilateral foot pain from February 2011 to March 2012 were recruited. Inclusion criteria were 1) a diagnosis with plantar fasciitis on one side by means of clinical characteristics, physical examinations, and ultrasonography, or 2) no improvement after conservative treatments (physical therapy, medication, and steroid injections) for three months. The diagnostic criteria of plantar fasciitis were required to fulfill all these prerequisites. In the first instance, the patients displayed symptoms of pain in the heel when they took their first steps after waking in the morning, pain and stiffening when they began to walk after having been seated for an extended period, and pain when their metatarsophalangeal joints were subject to dorsiflexion. Secondly, the patients experienced tenderness in the medial calcaneus in the proximal one-fourth of the foot. Lastly, through ultrasonography, an increase in the thickness of the plantar fascia on the affected side of over 3.8 mm, and more than a 1.0-mm gap in the thickness between the affected and non-affected sides, or topical low attenuation in the plantar fascia, needed to be shown [12]. The patients who satisfied all of the above three conditions were selected for our study. Those who did not consent to ESWT, those who suffered systemic diseases such as gout and rheumatoid arthritis, and those who had experienced previous foot injuries or contracted plantar fascia as a congenital disease were excluded from the study.
Of the 76 subjects recruited, 60 met the inclusion criteria. Written informed consent was obtained from all subjects prior to the study. The study was performed in accordance with the principles set forth in the Declaration of Helsinki.
Methods
Extracorporeal shock wave therapy
The subjects were placed into either a low-energy group (group L: n=30, 1,000 shocks/session, EFD per shock 0.08 mJ/mm2) or a medium-energy group (group M: n=30, 1,000 shocks/session, EFD per shock 0.16 mJ/mm2) through block randomization. All of the subjects received 3 sessions of ESWT at one-weekly intervals at differentiated energy levels according to their groups (group L3 and M3). In addition, the two groups were compared in terms of pain, function, and plantar fascia thickness. Afterward, group L3 received an additional 3 sessions of ESWT at one-weekly intervals, resulting in a total of 6 sessions of ESWT (group L6). Groups L6 and M3 were measured for pain, function, and plantar fascia thickness before ESWT, 1 week, 1 month, and 3 months after ESWT (Fig. 1).
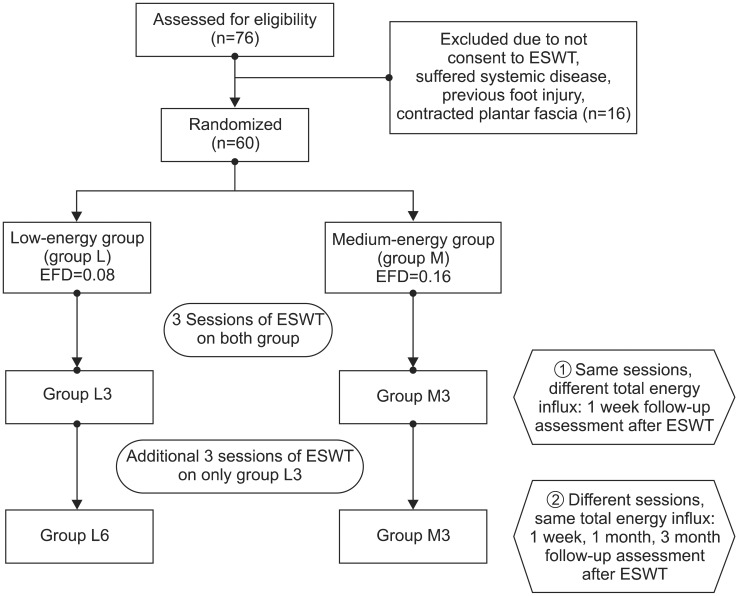
Flow diagram showing the treatment process and assessment. ESWT, extracorporeal shock wave therapy; EFD, energy flux density.
We used Dornier Epos Ultra (Dornier MedTech, Kennesaw, GA, USA), which was approved in 2001. The ESWT target area was set as the maximum tenderness area in medial calcaneus, in the proximal one-fourth of the foot. The subjects were not administered local anesthesia and were treated with shock waves 1,000 times at each session after the application of surgical lubricants. The practitioner frequently checked the treatment areas of the patients during the therapy and excluded those who developed side effects on the respective areas, such as bruising or edema. During the course of the experiment, the patients were prevented from receiving additional treatment, such as physical therapy, acupuncture, steroid injection, or anti-inflammatory drugs. The patients were informed of the amount of energy that was applied.
After each treatment, the subjects returned to their normal lives after resting on a bed for 10 minutes. Neither group was allowed to perform exercises that increased foot pressure, such as running and mountain-climbing, during the three-month treatment period.
Evaluation of pain
The subjective degree of pain felt by the patients was measured using a visual analog scale (VAS). The VAS scores were measured in relation to the degree of pain that patients experienced during their usual daily activities, such as when they slept, applied manual pressure, and took their first steps after waking in the morning.
Evaluation on functions
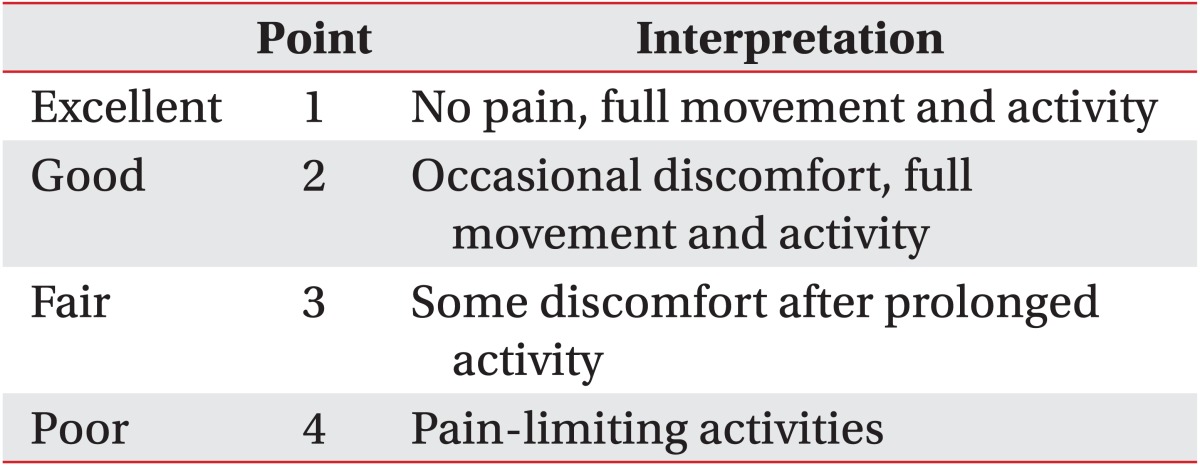
Roles and Maudsley (RM) scores [16] were used as a functional evaluation method. The RM scores were grouped in four categories (excellent, good, average, and poor), based on pain and activity ranges in daily life (Table 1).
Evaluation of the thickness of the plantar fascia
Measuring of the plantar fascia thickness was performed by an experienced physician using Accuvix V10 (Samsung Medison, Seoul, Korea). In order to minimize potential errors, an average of three measurement values of the thickness of the plantar fascia was taken at each evaluation session. The subjects adopted a prone position and maintained a posture in which they hung their feet over the edge of the test bed after a knee extension. The examiner identified the plantar fascia located at the thickest portion from the base of the medial calcaneal tubercle where a bright echogenic line was easily visible. The examiner then checked the thickness, hypoechogenicity, partial rupture, and calcification of the fascia (Fig. 2). The bony spur on the calcaneus was also evaluated before ESWT.

Ultrasonographic finding of plantar fasciitis. (A) Thickening of the plantar fascia, Sagittal sonogram of 40-year-old man who had a clinical diagnosis of plantar fasciitis. (B) Normal sonographic finding of plantar fascia.
Statistical analysis
A student t-test was used to compare the different total energy influx of the groups (groups L3 and M3). The treatment effects over time within each group and the differences in the treatment effects between two groups with the same total energy influx (groups L6 and M3) were examined using repeated measured ANOVA. A statistical analysis was performed using SPSS ver. 12.0 (SPSS Inc., Chicago, IL, USA), and the statistical significance level was set at p<0.05.
RESULTS
Patient characteristics
No statistical differences were observed between the two groups in terms of age, weight, body mass index, disease duration, and thickness of the plantar fascia (Table 2). Before the ESWT, ultrasonographic findings showed no difference between the two groups with respect to echogenicity, partial rupture, calcification, and bony spur on the calcaneus according to the radiographic film of the plantar fascia (Table 3). No cases arose in which the treatment was discontinued due to the occurrence of side effects or complications, although some patients complained of minor discomfort in the treatment areas.
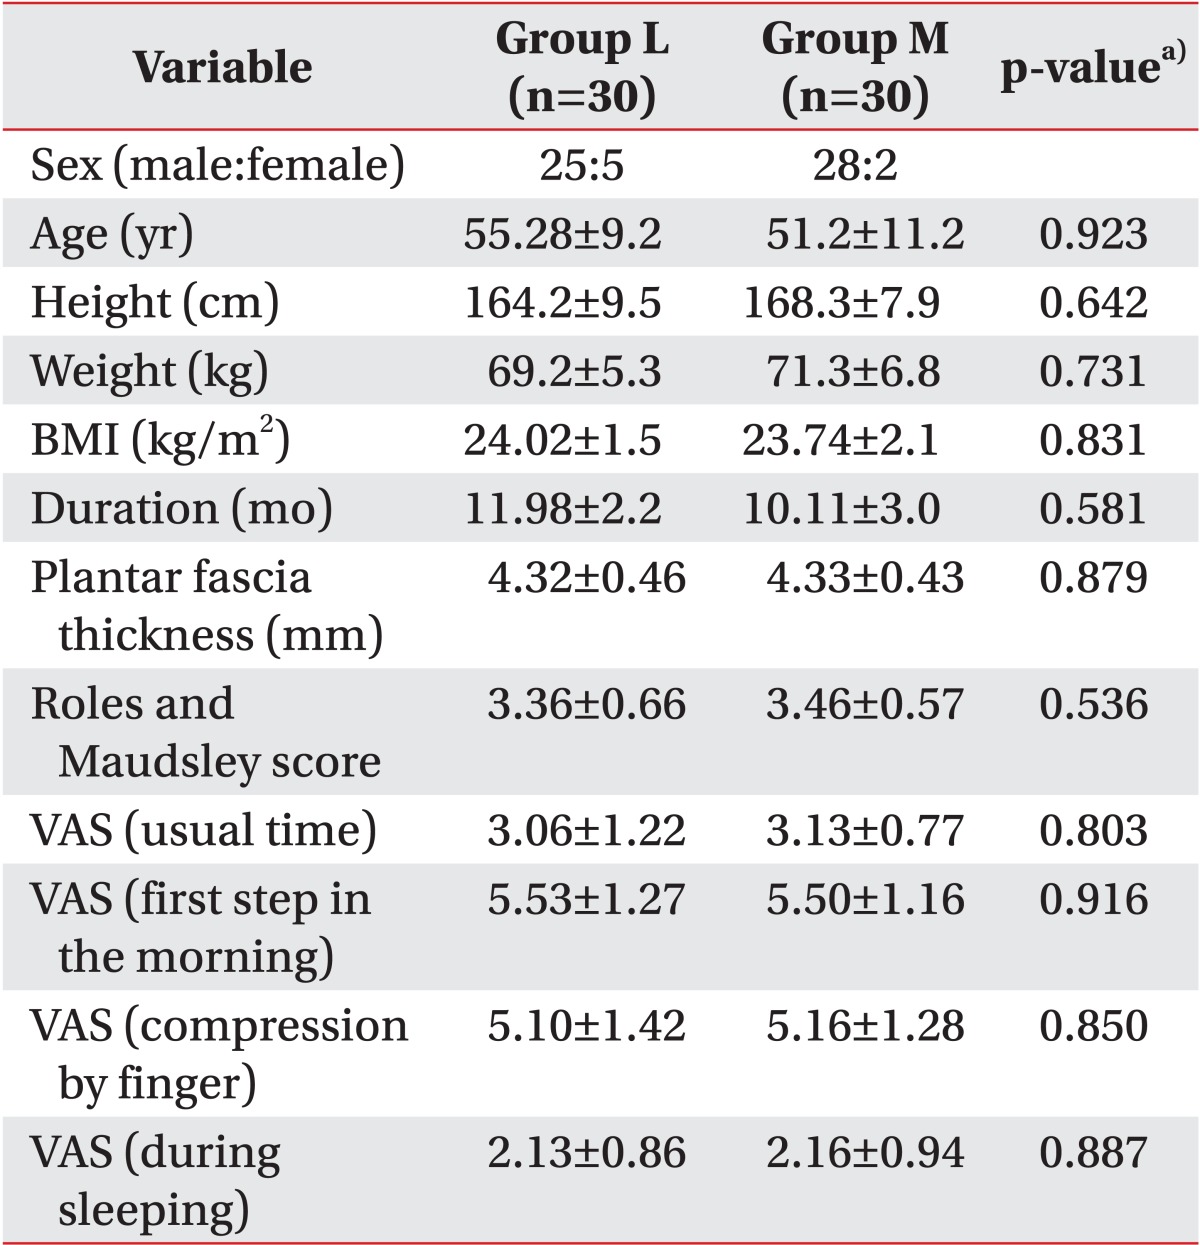
Demographic comparison between low- and medium-energy groups
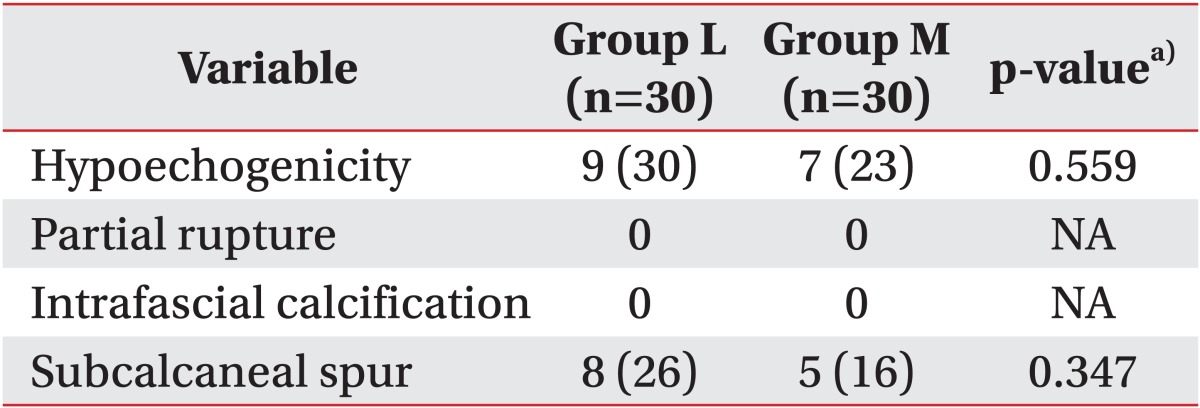
Ultrasonographic comparison between low- and high-energy groups
Changes in pain after ESWT
Group M3 experienced a larger pain reduction effect compared to group L3 (Table 4). In groups L6 and M3, across all scores (average VAS score during daily activities, sleep, during manual compression, and taking the first steps in the morning) statistically significant improvements were exhibited over time (p<0.001); however, the pain scores did not differ significantly between the two groups (p>0.05) (Fig. 3).
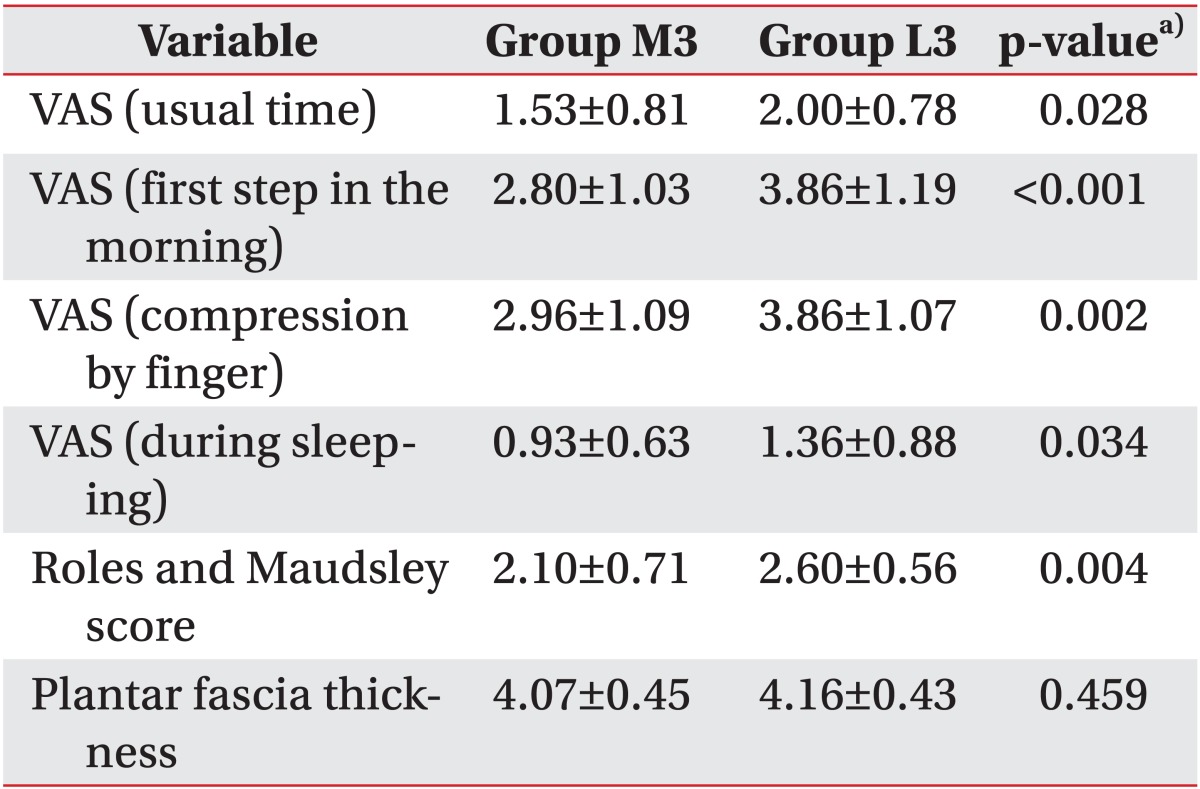
Comparison of VAS, functional score, and plantar fascia thickness between groups M3 and L3
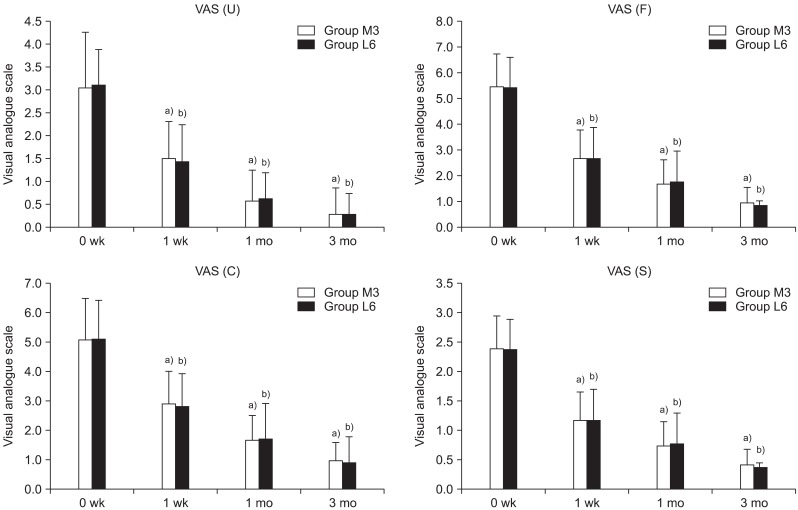
Temporal changes of pain (mean±standard deviation) at 0 and 1 week and at 1-3 month follow-up after extracorporeal shock wave therapy (ESWT) in the same total energy influx groups (groups M3 and L6). Group M3, 3 sessions of medium-energy (0.16 mJ/mm2) in ESWT group; group L6, 6 session of low-energy (0.08 mJ/mm2) ESWT group; VAS (U), visual analogue scale at usual time; VAS (F), visual analogue scale at first step in the morning; VAS (C), visual analogue scale of compression at calcaneus; VAS (S), visual analogue scale at sleeping. No significant difference was observed between both groups in VAS (U), p=0.717; VAS (F), p=0.778; VAS (C), p=0.829; and VAS (S), p=0.998. a)p<0.001 significantly different vs. 0 week within group M3. b)p<0.001 significantly different vs. 0 week within group L6.
Changes in functional scores after ESWT
Group M3 showed a greater improvement in RM scores compared to group L3 (p=0.004) (Table 4). The average RM scores in groups L6 and M3 improved statistically over time (p<0.001), but no statistically significant differences were apparent between the two groups (p=0.689) (Fig. 4).
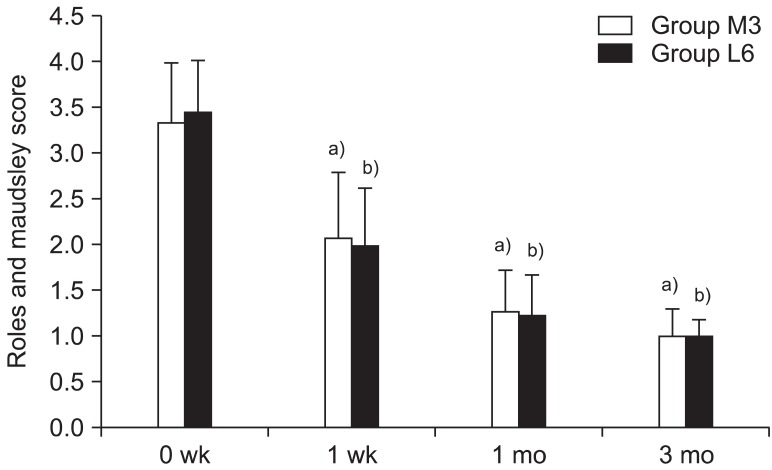
Temporal changes of Roles and Maudsley score (mean±standard deviation) at 0 and 1 week and at 1-3 months follow-up after extracorporeal shock wave therapy in the same total energy influx groups (groups M3 and L6). a)p<0.001 significantly different vs. 0 week within group M3. b)p<0.001 significantly different vs. 0 week within group L6. No significant difference between both groups (p=0.689) in Roles and Maudsley score.
Changes in the thickness of the plantar fascia after ESWT
Groups L3 and M3 did not show statistically significant differences in the thickness of the plantar fascia one week after the end of the treatment (p=0.459) (Table 4). Both groups L6 and M3 showed statistically significant improvement over time with a statistically significant decline in the thickness of the plantar fascia (p<0.001). In terms of the effects over time between group L6 and M3, no statistically significant differences were revealed (p=0.859) (Fig. 5).
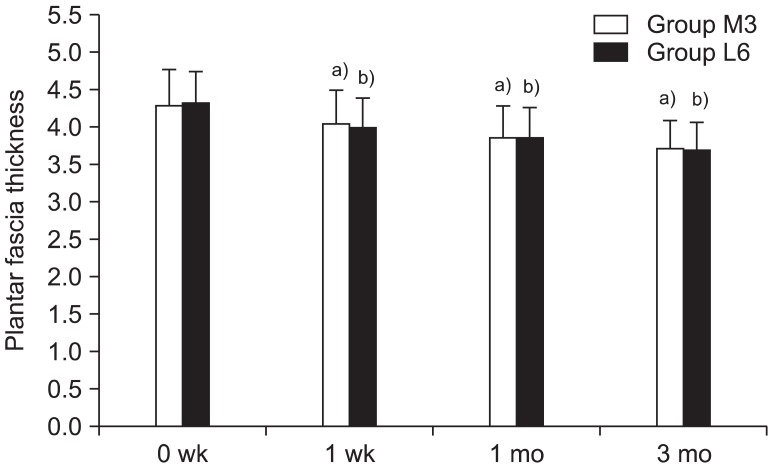
Temporal changes of plantar fascia thickness (mean±SD) at 0 and 1 week and at 1-3 month follow-up after extracorporeal shock wave therapy in the same total energy influx groups (group M3 and L6). a)p<0.001 significant difference vs. 0 week within group M3. b)p<0.001 significant difference vs. 0 week within group L6. No significant difference occurred between both groups (p=0.859) in plantar fascia thickness.
DISCUSSION
As a fiber tissue that originates on the medial calcaneus, the plantar fascia is attached to the forefoot along with various other tissues. Segmented into the medial, central, and lateral aponeurosis, the central aponeurosis is the origin of most problems. The cells in the plantar fascia consist of collagen and elastic fibers, and changes in the arrangement of the elastic fibers due to excessive loads can cause a stiffening of the fascia.
The conservative treatment methods for plantar fasciitis include the discontinuance of the exercises or activities that cause pain, stretching of the Achilles tendon and plantar fascia, heel pad, insole, night splint, anti-inflammatory drugs, and steroid injection. The effects of each treatment are presented with varying results according to different studies, and the most effective treatment method has not been clearly identified [17,18]. Furthermore, the success rates of these conservative treatments are reported to range from 44% to 90%; some researchers have also noted that the implementation of conservative treatments for plantar fasciitis is difficult [18-22]. ESWT is largely used in the treatment of plantar fasciitis given that the therapy is noninvasive, enables an immediate return to ordinary life, and its effects are similar to surgical interventions [23].
The mechanism of ESWT causes excessive excitement of the axon, affecting topical pain factors, thereby generating a reflexive analgesic effect and reduces pain by destroying unmyelinated sensory fibers. Moreover, it is known to improve the symptoms of the condition by an inflammatory response through the secretion of growth factors or nitrous oxide; it also repairs damaged tissues by encouraging angiogenesis [24-26].
However, not all the relevant studies have reported positive results regarding the effects of ESWT on plantar fasciitis. Indeed, some researchers have reported that ESWT was not effective when compared to the control group [27,28]. The reasons for such varied ESWT results include applicator position [29], the use of local anesthesia [30], and most importantly, the corresponding diverse intensity levels, defined as the energy flow through an area with perpendicular orientation to the wave propagation [31,32].
ESWT can be divided into different energy influx levels. Some previous studies [32,33] have divided the ESWT treatment intensity into three levels: 1) low intensity (EFD<0.08 mJ/mm2); 2) medium intensity (EFD, 0.08-0.28 mJ/mm2); and 3) high intensity (EFD>0.28 mJ/mm2). While the intensity or delivered energy is considered by some researchers to be a key factor for successful treatment [14,31], in current literature reviews, debate continues over the appropriate energy intensity and the total delivered energy that should be applied to the tissue.
While some studies that advocate the use of high-intensity energy report that it enables a single treatment and the treatment effects are superior [14,23], an increased energy influx within a short period of time results in a corresponding increase in pain, local swelling, and tenderness. Therefore, higher intensity treatments usually require local anesthesia, which is known to reduce the efficacy of the treatment [30]. Furthermore, some animal tests report that an influx of energy of over 0.60 mJ/mm2 can cause permanent damage on the tendon [34]. On the other hand, low-intensity energy is safer but has the disadvantage of lower treatment effects [25].
In this study, the treatment effects in the two groups were compared; groups L and M had low energy of 0.08 mJ/mm2 applied for six sessions and medium energy of 0.16 mJ/mm2 applied for three sessions, respectively. The medium-energy group showed statistically significant pain reduction and function scores improvement compared to the low-energy group when the same sessions were applied. This concurs with the results of previous studies, which demonstrated that higher-intensity energy destroys more unmyelinated sensory nerve fibers and thereby has a greater pain-reducing effect [35,36].
No standardized guidelines are available for the number of sessions needed when using ESWT in soft tissue condition [24]. However, numerous clinical studies have reported using two or three sessions for treating chronic tendinopathy, though this may reflect the clinical experience of the researchers. Takahashi et al. [35] reported the cumulative effects of repeated shock waves with single and double applications on nerve fibers and demonstrated that both groups showed nearly complete degeneration of epidermal nerve fibers until the fourth week of treatment. However, by the end of the sixth week of treatment, a reinnervation of the epidermis was detected in the single-treatment group, whereas reinnervation occurred more slowly in the repeat-treatment group. Therefore, they suggest multiple applications of ESWT provide longer-lasting nociceptive effects. Notwithstanding, their study differed from the current study since the researchers merely compared a single treatment with double applications while applying the same low energy, and investigated the number of degenerated nerve fibers instead of clinical indices. Additionally, no reports have been published regarding the time point of nerve reinnervation after multiple applications of three and six sessions, as given in the present paper.
In this study, an identical amount of total influx energy was applied to the two groups in a differentiated treatment schedule comprising of three and six sessions for groups M and L, respectively. In this case, both groups exhibited analgesic effects until three months after the end of the treatment. This demonstrates a longer-analgesic effect representing the cumulative effects of ESWT. In this study, the low-energy group with six sessions and the medium-energy group with three sessions, which each received the same total amount of energy influx, showed no differences in the scores of pain, function, and thickness of the plantar fascia. This may suggest that the effects of ESWT in plantar fasciitis are related not only to EFD but also to the times of sessions and total energy influx.
When plantar fasciitis is prolonged, it is known to reduce blood circulation around the plantar fascia, and subsequently cause a thickening of the plantar fascia. Previous studies [15,37] noted that ESWT revitalizes tissues by increasing angiogenesis and nitric oxide mediated anti-inflammatory effect, which thereby decreases the thickening of the plantar fascia by stabilizing inflammation. In this study, both groups exhibited a statistically significant decline in the thickness of the plantar fascia over time, which demonstrates a similar result to that of previous studies [13-15]. However, no differences in the thickness of the plantar fascia were detected between the medium-energy group with three sessions and the low-energy group with three sessions. Furthermore, when the two groups were compared one month and three months after the additional 3 sessions of ESWT were conducted on the low-energy group, no statistically significant differences were observed. Hammer et al. [15] reported the reduction of the plantar fascia was stable between 6 to 24 weeks after treatment. The result of our study, which shows no significant difference in plantar fascia thickness according to energy level, is most likely because the reduction of plantar fascia was not fully completed within the follow-up period. Calcagni et al. [38] compared the microvascular responses between two groups by applying different total energy influx, which comprised of 500 and 1,000 shocks at each session with low energy of 0.08 mJ/mm2. Both groups showed increased functional capillary density (FCD) and up-regulation of the proliferating cell nuclear body (PCNA). This tissue reaction started immediately after ESWT and slowly declined over a period of 3 days and 3 days after ESWT, the level of FCD and PCNA show no significant difference in both groups. The findings of their study concluded that there were no differences between the two groups when comparing the degrees of angiogenesis resulting from differentiated total energy influx. This supports the results of the current study in that no differences in the thickness of the plantar fascia resulted from differentiated total energy influx.
Contrary to the concerns that higher-intensity energy would be more likely to cause side effects, the medium-energy group in the present study did not show notable side effects that would cause treatment to be halted. This appears to be in accordance with the findings of an animal study in which it has been shown that tissue changes resulting from an energy of 0.28 mJ/mm2 or lower were reversible and could be recovered completely within four weeks [34].
In this study, ESWT with medium energy generated an effect identical to that of ESWT with low energy, but in half of the sessions required for same effect. This indicates that medium energy can be used as an energy level that increases patient-treatment compliance and is safe to apply. In addition, given the results of previous studies [23,39] in which medium-energy and high-energy groups exhibited no difference in terms of treatment effects, our findings suggest effective energy levels for pain reduction without side effects.
The limitations of this study are that no control group was employed to exclude placebo effects, no comparison of the treatment effects was made with a high-energy group, and the number of subjects was relatively small, with 30 patients in each group. Future studies will thus be necessary.
In conclusion, we aimed to evaluate the dose-related effect of ESWT by adjusting the times of sessions and EFD. In applying ESWT to the plantar fasciitis, the adoption of medium-energy level (0.16 mJ/mm2) was more efficient in terms of relieving pain and restoring functional activity than low-energy level (0.08 mJ/mm2) in the same session and showed no adverse effect. However, when different times of sessions were applied for the same total energy influx, different therapeutic effects in the different EFD groups no longer occurred. Therapeutic effect might disclose a dose-related relationship; therefore, EFD and times of sessions are considerable factors when treating with ESWT.
Notes
No potential conflict of interest relevant to this article was reported.