

INTRODUCTION
In patients with cerebral palsy (CP), bone mineral density (BMD) tends to be lowered. Osteoporosis accompanied with imbalance between bone resorption and formation in the bone turnover process, and fractures may occur frequently.1-5 Several studies of BMD in children with CP were performed. Henderson et al.4,5 analyzed factors affecting BMD in children and adolescents with quadriplegic CP with the gross motor function classification system (GMFCS) III and V. They mentioned weight age, severity, feeding difficulty, prior fracture, and use of anticonvulsants as the strongest predictive factors. According to bone strength-muscular force dynamics, mechanical pressure raised bone strength, so weight bearing was also an important factor affecting BMD.6 In addition, in spastic quadriplegic CP, BMD tended to be reduced in patients with poor nutrition in calcium and phosphorus and those taking anticovulsants.7 However, there have been few studies to properly research various factors in groups consisting of only adults with CP.
Accordingly, this study aimed to analyze the association of BMD scores with various factors such as age, gender, body mass index (BMI), neuromotor type, topographical distribution type, ambulatory function, and functional independence measure (FIM), to clarify their effect on BMD in adults with CP.
MATERIALS AND METHODS
Subjects
This study included 38 adults with CP who received inpatient or outpatient treatment. The mean age of subjects was 35.18±1.87 years. By decades, the number of 20's was 13, 30's was 10, 40's was 11, and 50's was 4. By gender, there were 18 males and 20 females. By subtypes according to topographical distribution in spastic CP, there were 6 spastic quadriplegia and 13 spastic diplegia. According to neuromotor classification, there were 19 spastic types and 19 dyskinetic types. Moreover, by calculating BMI from measurement of ther height and weight, patients were divided into lower BMI group of less than 18.5, normal BMI group between 18.5 and 25, and higher BMI group of over 25. In lower BMI group were 11, normal BMI group included 20, and higher BMI group were 7 (Table 1).
Methods
Dual-energy X-ray absorptiometry (DEXA) was used to measure BMD. Patients were divided into each group by gender, age, BMI, neuromotor type, topographical distribution, ambulatory function, and functional independence measure (FIM). The average T score of the second, third, and forth lumbar spine (L2-4) was measured. The average T score of femur neck, trochanter, and intertrocanter was also measured. Additionally, the functional level of all patients were evaluated by the FIM score. The FIM assessment included 18 detailed items comprised of self care, sphincter control, transfer locomotion, and soon. Each detailed item was scored from 1 to 7 points depending on the degree of independence.8
The ambulatory function was based on the criteria of the FIM's detailed item of locomotion.9 Patients with 1-2 points were classified as walking with complete dependence, who obtaining 3-5 points were classified as walking with modified dependence, and who obtaining 6-7 points were classified as independent walking group. The numbers of groups classified as walking with complete dependence, walking with modified dependence, and independent walking were 12 (32%), 12 (32%), and 14 (36%), respectively, among the 38 patients.
Statistical analysis
Statistical analysis was performed using the premier vendor for Statistical Package for Social Sciences (SPSS), Predictive Analytics Software Statistics (PASW) version 18. In adults with CP, BMD scores of each group classified by gender, age decade, neuromotor type, topographical distribution, and ambulatory function were compared using the Mann-Whitney U test or Kruskal-Wallis test, which are non-parametric statistical methods. In addition, the correlation of BMD scores with age, BMI or FIM scores were estimated with the Pearson correlation test. The trend line of the linear equation was also confirmed through regression analysis. A p-value of <0.05 was considered statistically significant.
RESULTS
BMD according to gender
The average T score of lumbar spine L2-4 of the 38 adults with CP was -1.08±0.22, and the average T score of the femur total was -1.50±0.20. In the BMD assessment according to gender, the average T score of lumbar spine was -1.29±0.29 in male with CP, and that of female with CP was -0.90±0.33. The average femur total T score was -1.59±0.24 in male with CP, and that of female with CP was -1.31±0.32. There was no statistical difference in BMD assessment of lumbar spine and femur by gender (Table 2).
BMD according to age
When comparing BMD by age decade, the average T score of lumbar spine L2-4 in 20's was -1.59±0.36, 30's was -0.49±0.42, 40's was -0.80±0.33, and 50's patient group was -1.70±0.88. The average T score of femur total in 20's, 30's, 40's, and 50's patient group was -2.05±0.34, -1.18±0.26, -0.98±0.40, and -1.90±0.61, respectively. There was no statistically significant difference in the lumbar spine and femur by age decade (Table 3). Moreover, there was no significant correlation between BMD score and age.
BMD according to BMI
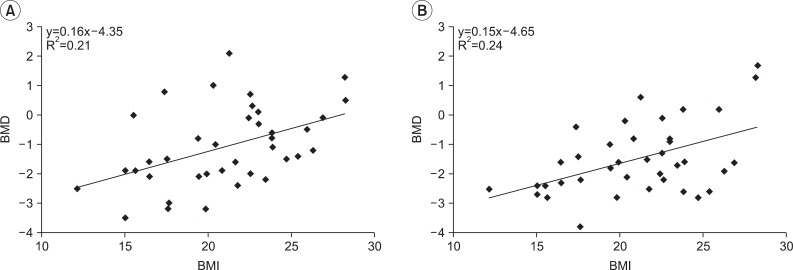
The trend line of lumbar spine was estimated by the linear equation y=0.16x-4.35 (R2=0.21), and on the trend line of femur, it was y=0.15x-4.65 (R2=0.24). The correlation coefficient of lumbar spine and femur was 0.456 and 0.486, respectively, with statistically significant positive correlation (p<0.05) (Fig. 1).
BMD according to neuromotor type
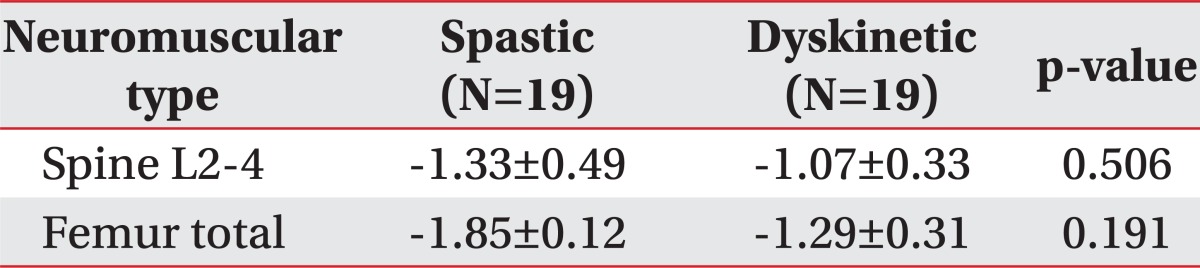
The average T score of lumbar spine L2-4 was -1.33±0.49 in spastic type and -1.07±0.33 in dyskinetic type. The average T score of femur total was -1.85±0.12 in spastic type and -1.29±0.31 in dyskinetic type. Although there was no statistically significant difference, the BMD of lumbar spine and femur tended to decrease in adults with spastic CP (Table 4).
BMD by topographical distribution
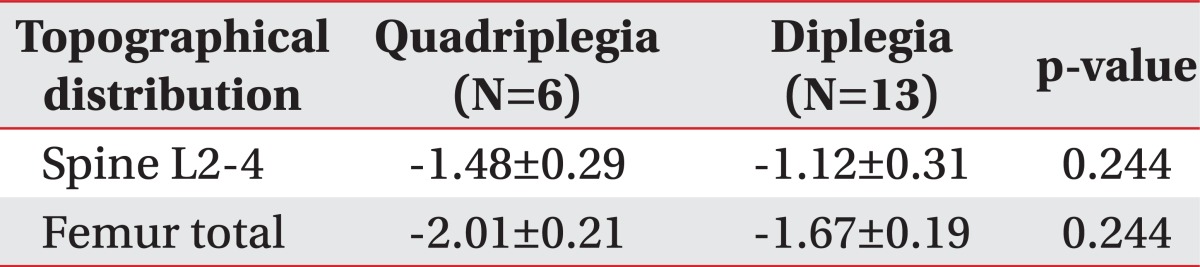
The average T score of the lumbar spine L2-4 was -1.48±0.29 in adults with spastic quadriplegia and -1.12±0.31 in adults with spatic diplegia. The average T score of the femur total was -2.01±0.21 in the quadriplegia and -1.67±0.19 in the diplegia. Although a trend that BMD decreased further in adults with quadriplegic CP was shown, there was no statistically significant difference (Table 5).
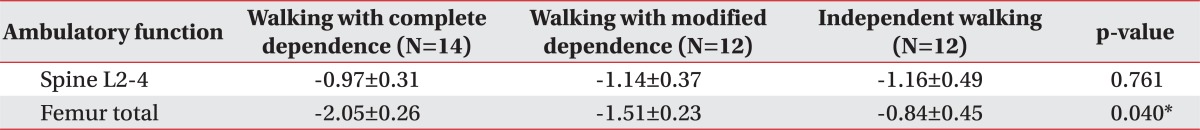
BMD according to ambulatory function
The average T score of lumbar spine L2-4 was -0.97±0.31 in the walking with complete dependence group, -1.14±0.37 in the walking with modified dependence group, and -1.16±0.49 in the independent walking group. There was no statistically significance difference in the lumbar spine by ambulatory function. However, the average T score of femur total was -2.05±0.26 in the walking with complete dependence group, whereas that of femur was -1.51±0.23 in the walking with modified dependence group, and -0.84±0.45 in the independent walking group. Thus, adult CP with higher ambulatory function had significantly higher BMD of femur (p<0.05) (Table 6).
BMD according to functional level
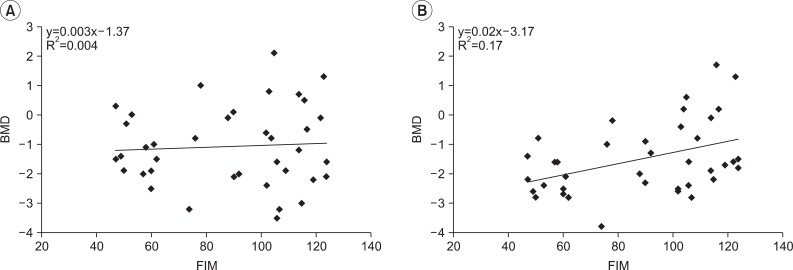
On the assessment of correlation between FIM score and BMD value, it was found that the linear simple equation was not correlated on the trend line in the lumbar spine. However, it was found that the correlation coefficient of femur total was 0.413, statistically significant. It was also shown that y=0.02x-3.17 (R2=0.17) in the femur total (Fig. 2).
DISCUSSION
Sheridan10 reported that BMD was lowered in more than 50% of adults with CP. Henderson et al.4,5 reported that weight, age, functional level, nutritional state, previous fracture history, and use of anticonvulsant were factors affecting BMD in children and adolescents with CP, but it was not focused on adults with CP. Besides, they enrolled only patients that could not walk independently. Therefore, this study was limited to adults with CP including independent walking group, and compared their BMD values according to various factors such as gender, age, BMI, ambulatory function, and FIM as well as neuromotor type11 and topographical distribution type.
Considering the BMD assessment in the normal adults, the average T scores of the lumbar spine was 1.14±0.16 (1.16±0.14 in 20's, 1.16±0.14 in 30's, 1.14±0.14 in 40's, and 1.13±0.17 in 50's), this study showed that the average T scores of the lumbar spine L2-4 was -1.08±0.22 and that of the femur total was -1.50±0.20 in the adults with CP, suggesting that they corresponded to osteopenia, general reduction of BMD.12
When assessing factors affecting BMD in adults with CP in this study, it was noted that gender had no significant effect on BMD. In the previous study performed on healthy adults,13 it was found that average BMD score of the spine and the femur did not differ by gender, with similar results in adults with CP. Besides, there was no statistically significant correlation between BMD and age, although it was previously reported that the BMD of patients with CP decreased with age in distal femur, in spite of increases in overall BMD.5 The study included children and adolescents in their growth period. However, this study was performed on adults whose growth period had already been over, so there is no significant association between BMD and age. Moreover, because there are no post-menopausal females and elderly over the age of 60 in this study, age had no significant on BMD. Instead, BMI, ambulatory function, and functional level have the stronger effects on BMD in adults with CP.
Although the Z score usually assesses BMD in children, this study was performed on adults with CP. Therefore, the T score was used in this study for the assessment of BMD based on the previous study.14 In addition, as BMI has been widely used to reduce bias by height and gender more than simply using body weight,13 BMI was used as an affecting factor in this study. As a result, BMI was positively correlated in BMD of both lumbar spine and femur. On the other hand, the FIM score was positively correlated with BMD of the femur alone. When the functional level such as FIM and ambulatory function is high, BMD is maintained by weight loading of the femur. But there is no significant correlation between FIM score and BMD of the lumbar spine. Despite insufficient functional levels, there may have been weight loading of the spine by sitting for extended periods. Consequently, weight bearing and functional level were factors affecting BMD in adults with CP.
According to the topographical distribution, there was no significant difference in comparison of BMD between spastic quadriplegia and spastic diplegia. Among total 19 patients with spastic CP, the number of quadriplegic CP was only 6 patients. Because the small sample size makes hard to obtain a statistically meaningful result, further research is necessary to recruit more subjects. Previous studies reported that use of anticonvulsants could increase secondary osteoporosis in children and adolescents with CP.15,16 But in this study, only 3 patients (8.5%) had medical history of taking anticonvulsants, so it was difficult to obtain a statistically significant result. Brunner et al.17 previously reported that the hip and knee joints were the most frequent fracture sites in a total of 37 patients with CP who had non-traumatic pathologic fracture. It also mentioned that osteoporosis caused by long-term physical inactivity might be a risk factor. However, this study had only two patients with femur neck fracture (5.7%), so it was difficult to identify the relationship. Therefore, further studies on factors affecting BMD including drug history, fracture history, subtypes and functional levels will be necessary in the future.
CONCLUSION
In adults with CP, BMI, ambulatory function and functional level affect their BMD. In particular, when BMI was higher, the BMD of lumbar spine and femur was increased with a significantly positive correlation. When ambulatory function and FIM score were higher, the BMD of femur was also increased with a significantly positive correlation. The results of this study are expected to be used as basic data to maintain BMD and to reduce secondary osteoporosis in adults with CP. Therefore, treatment including weight bearing exercise and gait training as well as general management of appropriate nutrition such as calcium, vitamin D and vitamin K are recommended.18