The Change of Intrinsic Stiffness in Gastrocnemius after Intensive Rehabilitation with Botulinum Toxin A Injection in Spastic Diplegic Cerebral Palsy
Article information
Abstract
A recent study claimed that botulinum toxin A (BTX-A) injection into the calf muscle of cerebral palsy (CP) children did not change the intrinsic stiffness. Contrary to this recent report, in our case, decreased muscle spasticity, which was measured using a modified Ashworth scale, and increased Gross Motor Function Measure score were demonstrated at 4 weeks after intensive rehabilitation treatment (IRT) with BTX-A injection to the medial gastrocnemius muscle in a child with spastic CP. Additionally, we indentified decreased muscle stiffness which was demonstrated by a decrease in the color-coded scale and shear velocity, and an increase in the strain ratio using dynamic sonoelastography.
INTRODUCTION
The precise quantification of spasticity in cerebral palsy (CP) is important in order to establish the effectiveness of medical and physical therapeutic interventions. One of the most relevant parameters used to quantify the stiffness (or elasticity) of soft tissues is Young's (or elastic) modulus.1 Young's modulus is the coefficient defining resistance to displacement. Hence, quantitative measurement of the distribution of Young's modulus (i.e., local muscle stiffness) within or between muscles could improve the accuracy of assessment of muscle stiffness.
Dynamic sonoelastography techniques have been developed in an effort to increase the objective analysis of muscle stiffness. Dynamic sonoelastography measures the propagation velocity of mechanical vibrations (e.g. shear waves) with imaging analyses to directly calculate the local Young's modulus of soft tissues, where faster velocity indicates a greater Young's modulus.2
We present the serial changes of stiffness of the medial gastrocnemius (GCM) after intensive rehabilitation treatment (IRT) with botulinum toxin-A (BTX-A) injection in a spastic CP using dynamic sono elastography.
CASE REPORT
The child was a 28-month-old boy (weight : 13 kg; height: 90 cm) with an established diagnosis of CP of the spastic bilateral type who presented with spastic equinus of both ankles. He managed to walk with the use of a hinged ankle-foot-orthosis.
He received an intramuscular injection of BTX-A Botox (Allergan Inc., Irvine, USA) 20 IU in both the medial and lateral GCMs using ultrasound guidance. After injection, IRT including stretching and strengthening exercises of the injected muscles with functional electrical stimulation was performed twice a day for four weeks.
Clinical and ultrasound assessments were performed at pre-injection and 4 weeks post-injection. The physical therapist measured the child's modified Ashworth scale (MAS), which was rated from 0 to 4, and Gross Motor Function Measure (GMFM) score at pre- and post-injection.
B-mode ultrasound and dynamic sonoelastography of the medial GCM in the longitudinal plane were performed together by a physiatrist using a commercially available ultrasound system with a 4-9 MHz multifrequency linear transducer S2000™ (Siemens Healthcare, Erlangen, Germany).
The child lay prone with the ankle in a neutral position during the scanning. Ultrasound was repeatedly performed at the proximal one third and medial points along the longitudinal reference line (originating from midway between the medial and lateral malleoli and terminating midway between the medial and lateral epicondyles). B-mode ultrasound images captured at the medial GCM were used for the measurement of muscle thickness.
Dynamic sonoelastography was displayed as a color-coded graphic representation and strain ratio between the gastrocnemius and soleus muscles of the relative stiffness of structures within the selected region of interest (ROI, 5×5 mm square). The local shear wave propagation velocity was then measured locally in the ROI (Fig. 1, 2). Purple indicated soft, green and yellow indicated intermediate stiffness, and red indicated hard. The elastic pattern in the medial GCM muscle was graded semiquantitatively on the dynamic sonoelastography as follows: 1 (purple to green: soft), 2 (green to yellow), 3 (yellow to red) and 4 (red: hard).3
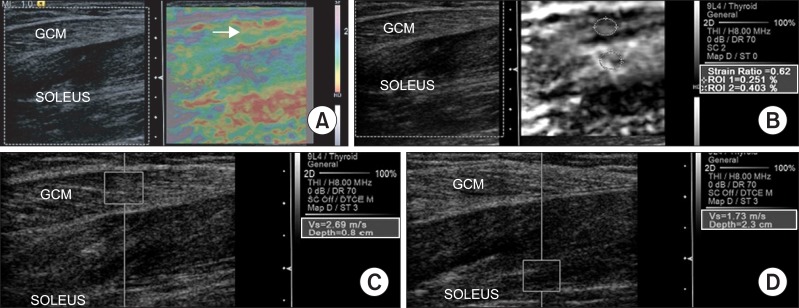
Sonoelastographic image presentation of local muscle stiffness superimposed on the longitudinal B-mode ultrasound image of the right medial gastrocnemius (GCM) muscle before intensive rehabilitation treatment with BTX-A injection. (A) Sonoelastographic image (right) showed yellow to red coloring (arrow). (B) Strain ratio between gastrocnemius and soleus muscles demonstrated 0.62. (C, D) Shear velocity in the medial GCM muscle and soleus muscle region revealed 2.69 m/s and 1.73 m/s, respectively.
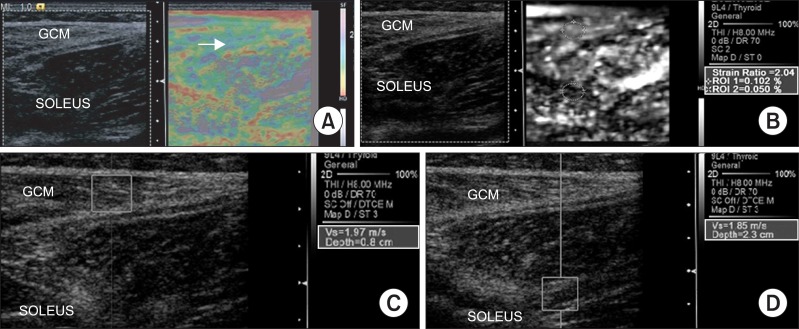
Sonoelastographic image presentation of local muscle stiffness superimposed on the longitudinal B-mode ultrasound image of the right medial gastrocnemius (GCM) muscle at 4 weeks intensive rehabilitation treatment with BTX-A injection. (A) Sonoelastographic image (right) showed purple to green coloring (arrow). (B) Strain ratio between gastrocnemius and soleus muscles demonstrated 2.04. (C, D) Shear velocity in the medial GCM muscle and soleus muscle region revealed 1.97 m/s and 1.85 m/s, respectively.
Decreased muscle spasticity, which was measured using a MAS, and increased GMFM score were demonstrated at 4 weeks after IRT with BTX-A injection (Table 1) (Fig. 1, 2). Dynamic sonoelastography showed decreased muscle stiffness which was demonstrated by a decrease in the color-coded scale and shear velocity, and an increase in the strain ratio using dynamic sonoelastography (Table 1) (Fig. 1, 2).
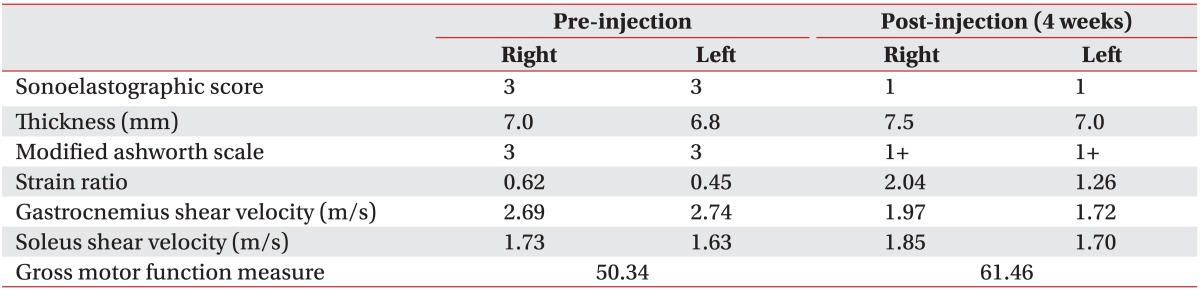
Summary of Outcome Measures at Pre and Post-injection of Intensive Rehabilitation Treatment with Botulinum Toxin A
DISCUSSION
Alhusaini et al.4 reported that children with CP who received BTX-A injected into the calf muscle did not show any change in the intrinsic stiffness in the injected muscle. However, in our case, after IRT with BTX-A injection of the medial GCM, there was a decrease in muscular spasticity and stiffness. These changes would be caused by IRT after the BTX-A injection.
Human research was not available to measure the change of spastic GCM thickness after the BTX-A injection. In general, the studies of BTX-A injection into the human skeletal muscle have shown a decrease in muscle size and thickness.5,6 In our case, the thickness of the medial GCM muscle was slightly increased at 4 weeks post-injection compared with pre-injection. The discrepancy of muscle thickness change after BTX-A injection can be attributed to several factors. Firstly, Chen et al.7 reported that voluntary exercise for seven days after BTX-A injection increased the mass (18%) and fiber size (23%) of a juvenile rat GCM muscle compared with the muscle without exercise. In our case, IRT might contribute to the increase of medial GCM thickness. Secondly, 20 units of BTX-A was injected in each GCM muscle. The injection dose (1.5 units/kg) was lower than that previously recommended (3-6 units/kg). Therefore, the degree of paralysis of injected GCM might be less. Lastly, the inaccuracy of ultrasound measurements con tributes to an unsatisfactory prediction of muscle thickness. However, the reliability of our examinations corresponds to that demonstrated by Heckmatt et al.8 whose study showed that intra-observer differences of muscle thickness measurement was 3 mm.
Thus far, this is the first report using the serial dynamic sonoelastography for the evaluation of stiffness of GCM muscle in a spastic CP child after IRT with BTX-A injection. In our case, using dynamic sonoelastography, the decrease of stiffness was demonstrated together with the improvement of GMFM score and decrease of spasticity.
ACKNOWLEDGEMENTS
This work was supported by research grants from the Catholic University of Daegu in 2010.