


INTRODUCTION
Nerve conduction study (NCS),combined with electromyography, is a standard test used to diagnose and evaluate patients suspected of having peripheral neuromuscular impairments [1]. Along with radiologic studies, it plays a critical role in making treatment decisions. However, the normal ranges and reference values of the test tended to vary among institutions and hospitals due to their variability and dependency on multiple physiological and environmental factors. These factors include age, sex, height, room temperature, and humidity, as well as the practitioner’s experience and technique [2-4]. This makes the test results unreliable and incompatible among facilities. Thus, patients would undergo the same electrodiagnostic studies when visiting another institution, causing unnecessary medical expense, inconvenience for the patients, and difficulty in assessing and maintaining the test’s quality.
Several studies have attempted to establish a universal set of normative ranges for NCS that specify many of the confounding factors mentioned above. The Normative Data Task Force (NDTF) by the American Association of Neuromuscular & Electrodiagnostic Medicine (AANEM) is the most famous among these [5-8]. NDTF studied reports on NCS from 1990 to 2012 and presented a set of normal values; however, the values reported were based on single studies that met their statistical and methodological standards. None were given in the form of uncertainty, raising questions on the results’ robustness [6,9,10].
Uncertainty is a relatively new concept in the history of measurement, although reports on mean value and standard deviation have been a general practice in science. Since the publication of the Guide to the Expression of Uncertainty in Measurement (GUM) in 1995 by the Joint Committee for Guides in Metrology (JCGM), it is well noticed now that different measurement results cannot be directly compared unless there is a specified indication of the result quality, which is uncertainty [11]. Aside from measurement errors, other known and suspected factors of uncertainty must be considered to reflect the reliability and reproducibility of the measurement. For example, in 2017, the Korean National Health Insurance Service reported an uncertainty-based reference standard for blood glucose levels based on the database from national routine medical check-ups [12]. Based on our knowledge, no other research group has adopted the concept of uncertainty in standard references for NCSs.
The tibial and common peroneal nerve are the two main motor nerves innervating the muscles in the lower leg and foot, causing muscle weakness or gait disturbance when injured or compromised. In particular, compressive peroneal neuropathy at the fibular head level is one of the most common entrapment neuropathies of the lower extremity in clinical settings. NCSs are essential for its diagnosis [13]. The sural and superficial peroneal nerves are the two main sensory nerves of the lower extremities, each branching from the tibial and the common peroneal nerves.
Therefore, the main goal of this study was to establish a robust database of reference standards for lower extremity motor and sensory NCSs: tibial, common peroneal, sural, and superficial peroneal nerves in the Korean population. This will include a detailed consideration for uncertainty, including inter- and intra-individual variabilities, environmental factors, and instrumental variabilities.
MATERIALS AND METHODS
Participants
After obtaining Institutional Review Board approval from Seoul National University Hospital, Seoul National University Bundang Hospital, and Seoul National University Boramae Medical Center (IRB No. 1804-125-940), healthy participants in their 20s or 50s were recruited between August 2018 and November 2019. Patients with diabetes mellitus, hypothyroidism or hyperthyroidism, previous diagnosis of cancer, or a history of chemotherapy were excluded. Participants with paresthesia or hypesthesia on any of their limbs for more than 1 month within the last 3 months, pregnant women, and those currently taking medications that might affect peripheral nerve functions were excluded as well. Demographic data including age, height, weight, soft lean mass (SLM), body fat mass (BFM), skeletal muscle mass (SMM), and body mass index (BMI) were collected. SLM, BFM, and SMM were collected using InBody 770, InBody S10, and InBody 720 Body Composition Analyzers (Biospace Co. Ltd, Seoul, South Korea) from each hospital. Participants were instructed to stand still with their socks off on the apparatus, while a weak electrical current flowed through the extremities and calculated the bioelectrical impedance. BMI was calculated as weight divided by height squared (kg/m2).
Test settings and instruments
All NCSs were conducted in one of the five magnetically shielded rooms from three different hospitals in Seoul, Korea. The studies were conducted using the Nicolet EDX (Natus Medical Inc., Pleasanton, CA, USA), which consists of a digital signal processing unit, electrical stimulator probes, recording electrode, two-channel amplifier, frequency filter, averager, audio speaker, and screen monitor. Surface electrodes were used as the active, reference, and ground electrodes. For the tibial and common peroneal NCS, the recording sweep speed was set to 2–5 ms/division, and the sensitivity was set to 1 mV/division and 10 mV/division, respectively. For the sural and superficial peroneal NCS, sweep speed and sensitivity were set to 2 ms/division and 20 μV/division, respectively. Sensitivity was adjusted to ensure that the entire waveform, including the peak of the amplitude, was clearly visualized on the screen. All recording tools, tape measures, thermometers, hygrometers, and the main electrodiagnostic systems were annually tested and calibrated by organizations officially certified by the Korea Laboratory Accreditation Scheme.
Test protocol for nerve conduction studies
General consideration
Room temperature and humidity were set to 15°C–27°C and 10%–80%, respectively. The skin temperature measured by the aforementioned thermometer was between 32°C–37°C. The participants were instructed to remove any cosmetics applied on their skin to improve skin contact and reduce electrical resistance. In all cases, stimulus duration was set to 0.1 ms. Supramaximal intensity was used to obtain the optimal results. Stimulus intensity was increased gradually until the amplitude did not increase any further. Then, the actual response was obtained with an additional 10%–20% increase in intensity to ensure that supramaximal stimulation was given. When supramaximal stimulation cannot be obtained with a stimulus duration of 0.1 ms (due to obesity, edema, or pain intolerance), a longer stimulus duration was used. For the sural sensory and superficial peroneal sensory nerves, the antidromic method was selected.
Tibial nerve
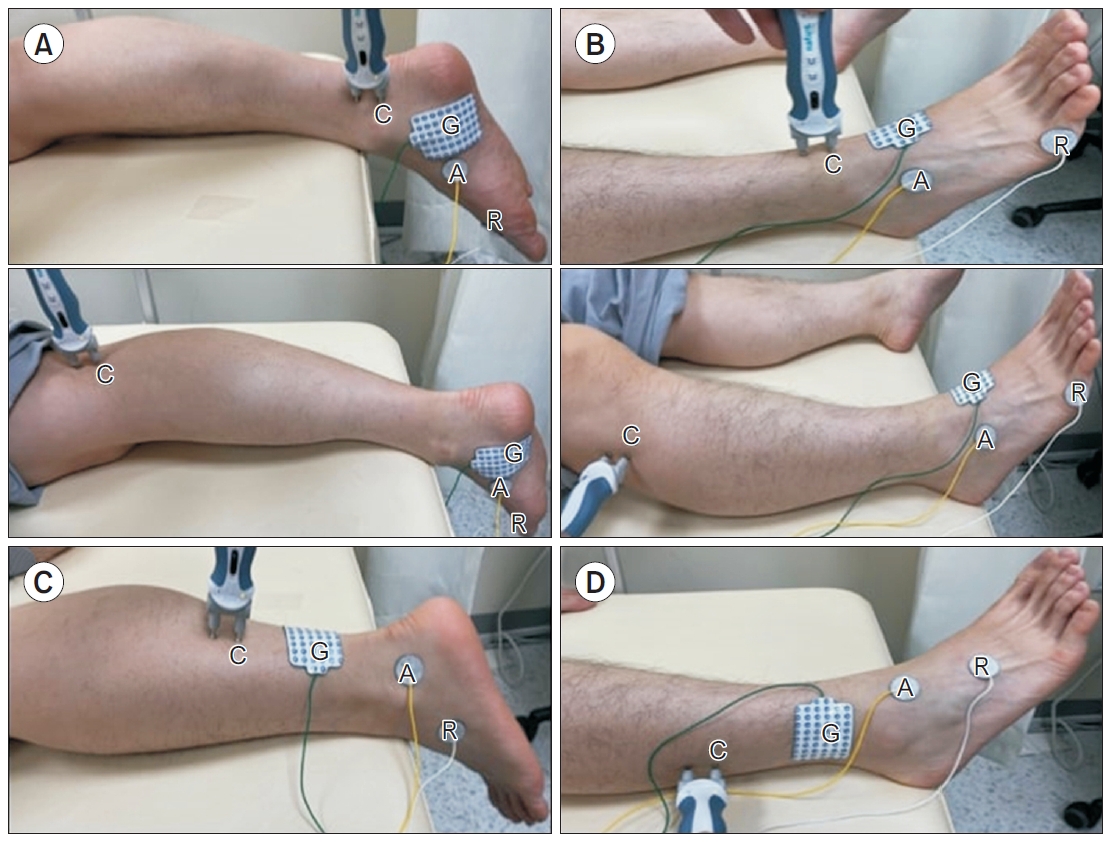
Participants were asked to lie on their stomach and let their feet hang naturally just over the edge of the bed. The active electrode was placed 1 cm posterior and 1 cm below the navicular tubercle on the abductor hallucis muscle bulk. After nerve stimulation, the electrode was repositioned to obtain the optimal compound motor action potential (CMAP). The reference electrode was attached to the first metatarsophalangeal joint or the big toe, and the ground electrode was placed between the active electrode and the distal stimulation site. For distal stimulation, the probe was placed immediately behind the medial malleolus, 8 cm proximal to the active electrode. Proximal stimulation was performed at the popliteal fossa, one-third to one-half lateral to the popliteal crease (Fig. 1A).
Common peroneal nerve
Participants were asked to lie on their back, and the active electrode was placed at the most prominent part of the extensor digitorum brevis, which lies on the anterolateral side of the proximal midtarsal area. The reference electrode was attached to the fifth metatarsophalangeal joint or the fifth digit, and the ground electrode was placed between the active electrode and the distal stimulation site. Distal stimulation was placed just lateral to the tibialis anterior tendon, 8 cm proximal to the active electrode. Proximal stimulation was performed immediately below and lateral to the fibular head (Fig. 1B).
The accessory deep peroneal nerve is a common anatomical variant where a separate branch of the common peroneal nerve proceeds posterior to the lateral malleolus and innervates the extensor digitorum brevis. In cases where the proximal amplitude was larger than the distal amplitude, the presence of an accessory deep peroneal nerve was evaluated by providing an additional stimulus from behind the lateral malleolus.
Sural nerve
Participants were asked to lie on their stomach and let their feet hang just over the edge of the bed, as done in tibial nerve studies. The active electrode was placed posteroinferiorly to the lateral malleolus, and the reference electrode was placed at least 4 cm distal to the active electrode. The ground electrode was placed between the active electrode and stimulation site. The stimulus was placed 14 cm proximal to the active electrode, slightly lateral to the midline of the posterior calf. The examiner slightly moved the probe to obtain the optimal sensory nerve action potential (SNAP) (Fig. 1C).
The sural nerve also has anatomical variants where the lateral sural cutaneous nerve, branching from the common peroneal nerve, and the medial sural cutaneous nerve, branching from the tibial nerve, may or may not converge at the site of stimulation. In this study, we targeted the lateral sural cutaneous nerve, thus placing the probe slightly lateral from the midline.
Superficial peroneal nerve
Participants were asked to lie on their back, and the active electrode was placed 1–2 cm medial to the lateral malleolus to target the intermediate dorsal cutaneous branch. The reference electrode was placed at least 4 cm distal to the active electrode, and the ground electrode was placed between the active electrode and the stimulation site. Stimulation was given 14 cm proximal to the active electrode, just anterior to the anterior border of the fibula (Fig. 1D).
Outcome parameters
For motor conduction studies, the following parameters were obtained from distal and proximal stimulation: onset latency (Lonset), baseline to negative peak amplitude (Ampbase-peak), negative peak to positive peak amplitude (Amppeak-peak), negative spike area (Aneg), and negative spike duration (Dneg). NCV was calculated by dividing the length between the distal and proximal stimulation sites by the latency difference. Proximal to distal amplitude ratio (Ratioamp= proximal Ampbase-peak/distal Ampbase-peak) and proximal to distalarea ratio (Ratioarea=proximal Aneg/ distal Aneg) were also calculated. For sensory conduction studies, the following parameters were obtained: Lonset, Ampbase-peak, Amppeak-peak, Aneg, and Dneg.
Evaluation of uncertainty
Evaluation of uncertainty was applied for the following measurands: Lonset, Ampbase-peak, Amppeak-peak, Aneg, and Dneg, NCV, Ratioamp, and Ratioarea. The evaluation of uncertainty carefully followed the international GUM protocol [11]. A “measurand” can be defined as a physical quantity that is subject to measurement.
Modeling the measurement
The result of a measurement, or an estimate of a measurand, consists of a reading value from the electrodiagnostic system and a correction value. The model equation for each measurand is given in Supplementary Table S1.
For each measurand, the uncertainty factors for the reading value and correction value were acknowledged and evaluated. Uncertainty factors that we considered for each measurand are summarized in Supplementary Table S2. For Aneg, Dneg, and Ratioarea, conventional standard deviation was used instead of expanded uncertainty, considering the technical difficulty of calibrating the parameters of the electrodiagnostic system. We also judged that the uncertainty portion of the correction value would be negligible compared to the standard deviation of the reading value, even if calibration was possible.
Uncertainties can be categorized into two types: those determined by random effects and those arising from known systematic effects. Uncertainty arising from random effects were statistically evaluated by repeated observations. Uncertainty arising from systematic effects were evaluated on the basis of available preexisting data, calibration reports, readily known sensitivity coefficients, etc.
Combined standard uncertainty and expanded uncertainty
For measurands except Ratioamp, all uncertainty factors were independent; thus, the combined standard uncertainty u(Y) is given by the following equation:
In the case of Ratioamp, uncertainty factors were deemed to be correlated. Thus the combined standard uncertainty was calculated as follows:
In Equations (1) and (2), Y and Xi represent the measurand and each uncertainty factor, respectively. The expanded uncertainty U(Y) was reported as the combined standard uncertainty multiplied by the coverage factor. In our study, the coverage factor k was assigned as 2 to ensure the conventional 95% confidence level.
Statistical analysis
Means with either expanded uncertainty or standard deviation were suggested for all parameters, stratified by age group and sex. The p-values for sex-wise and age-wise comparisons were evaluated with Student t-test for all parameters. A 3rd to 97th percentile range was reported in consideration of the skewed parameter distribution as well as the intention of comparing the results with NDTF’s suggested data. This was done for certain motor nerve parameters (Lonset, Ampbase-peak, and NCV) and sensory nerve parameters (Lonset, Ampbase-peak, Amppeak-peak).
For onset latency, amplitude, and NCV, further analysis of side-to-side differences in each individual was conducted to investigate the upper limits of normally observable side-to-side discrepancies in each parameter. For onset latency, results are reported in their original millisecond units. For amplitude and conduction velocity, differences are reported in percentages compared to the larger side, due to their higher variability, even within the normal population. Upper limits were set as the mean+2SD.
All statistical analyses were performed using R version 4.0.5 (https://cran.r-project.org/bin/windows/base/old/4.0.5/) and tidyverse package (v1.3.1; https://cran.r-project.org/web/packages/tidyverse/vignettes/paper.html).
RESULTS
Demographics and anthropometrics
A total of 205 participants in their 20s and 50s were first enrolled, and six were excluded from the analysis: one participant was in his 40s, two were duplicates, two failed to finish the study due to pain, and one showed no responses at both superficial peroneal nerves, which the authors deemed abnormal. Thus, 398 limbs from 199 participants (100 in their 20s and 99 in their 50s) were included in the final analysis.
Demographic data are shown in Supplementary Table S3. In brief, male participants in their 50s were significantly shorter, weighed less, had less SLM, and less SMM than those in their 20s. Female participants in their 50s were significantly shorter, weighed more, had more SLM, BFM, and SMM, as well as higher BMI compared to females in their 20s.
Supramaximal stimulus intensity
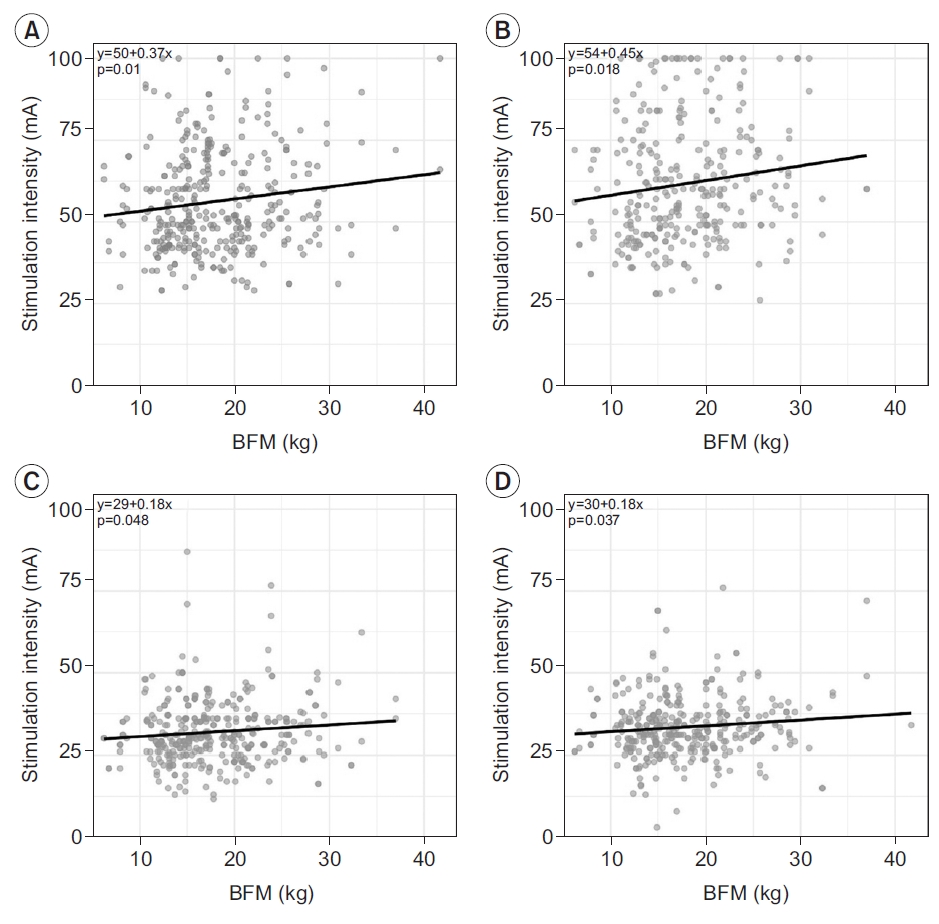
Stimulus intensity for supramaximal stimulation was investigated for each of the four nerves (Supplementary Table S4). In tibial nerve study, majority of the cases were conducted with a stimulus duration of 0.2 ms, while for other nerves, a stimulus duration of 0.1 ms was used in most cases. Moreover, cases performed with 0.2 ms were selected and analyzed for the tibial nerve. For the common peroneal, sural, and superficial peroneal nerves, cases performed with 0.1 ms were analyzed. There was no significant difference in stimulus intensity between the 20s and 50s, except for distal tibial nerve stimulation (p=0.044). For the common peroneal nerve in both distal and proximal stimulation, male participants required significantly higher stimulus intensity. A significantly higher stimulus intensity was required for proximal stimulation compared to distal stimulation in the tibial nerve, but no difference was noted in the common peroneal nerve. In all four studied nerves, supramaximal stimulus intensity was significantly higher in participants with a larger BFM (Fig. 2).
Reference values and expanded uncertainties
Tables 1–4 show the reference values and expanded uncertainties of each parameter for each nerve. For the tibial and common peroneal nerves, the length between distal and proximal stimulation sites are as follows: tibial nerve (male 20s 39.1±2.7 cm, male 50s 37.8±2.4 cm, female 20s 34.8±2.0 cm, female 50s 33.7±2.0 cm) and Common peroneal nerve (male 20s 33.6±2.7 cm, male 50s 32.0±2.7 cm, female 20s 30.1±2.2 cm, female 50s 30.1±3.1 cm).
In all four nerves, Ampbase-peak, Amppeak-peak, and Aneg were significantly larger in the 20s than the 50s group, both in males and females. For NCV, no significant age effect was noted among the nerves except for the common peroneal nerve in males (p=0.002).
To help understand the actual distribution of each parameter, histograms of the three most commonly recognized parameters of the tibial nerve (distal Lonset, distal Ampbase-peak, NCV) and two parameters of the sural nerve (Lonset and Ampbase-peak) in men in their 20s are presented as supplementary data (Supplementary Figs. S1, S2). All parameters were normally distributed according to Kolmogorov-Smirnov test, except for Dneg of superficial peroneal nerve in women in their 50s.
Anatomical variation
In the common peroneal nerve, 22 participants out of 199 (11.1%) had an accessory deep peroneal nerve, of which 45.4% were bilateral (n=10) and 54.5% were unilateral (n=12). Thirty-two out of the 398 limbs (8.04%) had accessory deep peroneal nerves. For proximal measurands, data from participants with accessory deep peroneal nerves were excluded from the analysis.
Side-to-side difference and proximal-to-distal difference
The mean and standard deviation of the side-to-side differences for the selected parameters are summarized in Table 5, along with the suggested upper limits. For the tibial and common peroneal nerves, the normal upper limit for side-to-side onset latency difference is approximately 1.3 ms (1.37 ms and 1.26 ms, respectively), while the CMAP amplitude difference is approximately 50% (46.06% and 49.68%, respectively). For the sural and superficial peroneal nerves, a side-to-side SNAP amplitude difference of approximately 30% (27.45% and 31.85%, respectively) can be deemed normal. For NCV of the tibial and common peroneal nerves, a difference of 23.44% and 15.93% for each nerve may be assumed to be of normal variation.
For proximal-to-distal differences in the tibial and common peroneal nerves, the lower limits for the Ratioamp were approximately 60% and 70%, respectively. The lower limits for Ratioarea were approximately 70% and 80%, respectively.
DISCUSSION
This study presents a large robust database of reference standards for lower extremity NCSs in the Asian population. This is accompanied by expanded uncertainty values, which, to the best of our knowledge, is the first to do this in such a manner. In addition, other parameters, including supramaximal stimulation intensity, amplitude ratio, and area ratio between the ankle and knee, and side-to-side differences in parameters were included and thoroughly evaluated.
Several studies have emphasized that an adequately large number of participants is needed to derive normative data [14,15]. A previous study asserted that a minimum of 120 participants are needed to report a reliable reference value [15]. Another investigation noted that at least 50 participants are needed to evaluate side-to-side differences [14]. Our study analyzed a total of 199 participants, which is a considerably large number compared to previous studies that presented normative values.
Comparison to previous studies
Three studies by Buschbacher [6,9,10] met the NDTF inclusion criteria for the tibial, common peroneal, and sural nerves. However, no study on the superficial peroneal nerve met the NDTF inclusion criteria.
In Buschbacher’s tibial nerve study [10], the upper limits for Lonset and Dneg were 6.1 ms and 8.7 ms, respectively, which were both pooled from all participants. The lower limits for Ampbase-peak and Aneg were suggested differently based on age groups. For age 19–29, 30–59, and 60–79, upper limit values of 5.8 mV, 5.3 mV, 1.1 mV were suggested for Ampbase-peak. When pooled together, the 3rd percentile cut-off value was 4.4 mV. For Aneg, age group was divided into 19–49 and 50–79, with a 3rd percentile cut-off value of 14.2 mVms and 5.0 mVms, respectively. When pooled together, 9.1 mVms was given as the overall cut-off value. NCV results were presented in subgroups of age and height, with smaller participants showing slower NCV. When all pooled together, a 3rd percentile cut-off value of 39 m/s was given. A comparison of our results on the tibial nerve to Buschbacher’s results showed that the upper limits for Lonset and Dneg tended to be lower, and the lower limits for Ampbase-peak and Aneg tended to be higher in our results. The NCV results were similar.
For the peroneal nerve, Buschbacher [6] presented the upper limits for Lonset and Dneg as 6.5 ms and 7.7 ms. Lower limits for Ampbase-peak were 2.6 mV and 1.1 mV for age group 19–39 and 40–79, respectively. Lower limits for Aneg were 6.8 mVms and 3.6 mVms for age group 19–49 and 50–79. NCV results were presented in subgroups of age and height as in the case of the tibial nerve, with a pooled result of 42 m/s as the 3rd percentile cut-off value.
For the sural nerve, Buschbacher [9] suggested the 97th percentile cut-off values for Lonset and Dneg as 3.6ms and 2.1 ms, and the 3rd percentile cut-off values for Ampbase-peak, Amppeak-peak as 4 μV and 4 μV. In our results, the 97th percentile cut-off value for Lonset is similar to Buschbacher’s 3.3 ms-value, while the 3rd percentile cut-off values for Ampbase-peak, Amppeak-peak were 13.7 μV and 12.2 μV, which are much larger than Buschbacher’s. However, considering the development of the electrodiagnostic technology since Buschbacher’s studies [6,9,10], differences in demographics and study protocols, and the consideration of uncertainty in our study, a direct comparison between Buschbacher’s results and ours is of limited value.
Expanded uncertainty
Among the uncertainty factors listed in Supplementary Table S2, the uncertainty of the difference in measurement between participants, or “standard deviation” in conventional terms, was the most significant. It is known that demographic attributes such as age, sex, ethnicity, height, digit circumference, and limb length may influence NCS results [2-4], thus contributing to the majority of the analyzed uncertainty. Temperature is also an important uncertainty factor. Previous studies reported that the NCV of the tibial, peroneal, and sural nerves decreased 1.1 m/s, 1.7 m/s, and 2 m/s, respectively, with every 1°C decline in temperature [4]. In our study, the local temperature was controlled within 32°C–37°C, which carries the possibility of altering NCV by as much as 10 m/s. Among other uncertainty factors, the uncertainty caused by the practitioner’s manual selection of points on the waveform displayed on the monitor was also noticeable.
To help understand this, the calculated values of each uncertainty factor for distal onset latency of the tibial nerve in men in their 20s are presented as an example (Supplementary Table S5).
Age and sex differences
There have been many reports on the effects of age and sex on NCS. NCV and amplitude decrease as a normal process of aging, as large nerve fibers deteriorate and segmental demyelination/remyelination occur [2,16-18]. However, the effect of sex on NCS parameters remains controversial. Some reports demonstrated that females had slightly increased SNAP amplitudes for the median and ulnar nerves, and that females had a greater NCV for both upper and lower limb nerves [19,20]. Nonetheless, these differences were minimized or disappeared when they were adjusted by height, except for amplitude, which persisted after height adjustment [21]. In Buschbacher’s studies [6,9,10] on the tibial, common peroneal, and sural nerves, sex had no effect, while the effect of aging on NCV and amplitude mentioned above was confirmed once again.
In our study results, pre-adjustment data showed that age differences were present in almost all parameters of all nerves. However, differences in sex showed highly inconsistent results for each nerve and parameter. When adjusted for anthropometric attributes, most of the differences in sex disappeared. However, the Ampbase-peak, Amppeak-peak, and Aneg for SNAP of the sural and superficial peroneal nerves showed a significantly larger result for females even after adjustment.
Our pre-adjustment data showed that for the tibial and sural nerves, the distal onset latency was significantly larger in women in their 20s than in their 50s, which contradicts the common notion that distal onset latency is shorter in younger adults and increases as they get older. We believe these results are partly due to the BMI difference between women in their 20s and 50s. Buschbacher’s study on BMI and common NCS measurements [22] showed a significant negative correlation between BMI and distal onset latency in multiple nerves (ulnar motor nerve, peroneal motor nerve, ulnar sensory nerve, and radial sensory nerve). Our demographic data showed that there was a significant BMI difference of 2.2 kg/m2 between women in their 20s and 50s, while males of different age groups were similar in terms of BMI. Other factors with potential influence on distal onset latency, including skin temperature or height, showed either no significant difference or clinically minimal importance. Further studies are warranted to determine the effects of BMI and other confounding factors on NCS parameters.
Supramaximal stimulus intensity
To the best of our knowledge, this is the first study to provide descriptive data on supramaximal stimulus intensity in a healthy Asian population. First, stimulus duration must be considered, as comparison of stimulus intensity from different stimulus durations is clinically meaningless. In our study, a stimulus duration of 0.2 ms was used in approximately 90% of cases (350 out of 398 in distal stimulation and 349 out of 398 in proximal stimulation) for the tibial nerve. In most cases, either a stimulus duration of 0.1 ms was insufficient to reach a supramaximal stimulation even with the hardware’s maximal intensity of 100 mA. In other cases, participants were intolerable to pain when given high stimulus intensity, thus the stimulus duration was increased instead. In most cases of the common peroneal, sural, and superficial peroneal nerves, a stimulus duration of 0.1 ms was sufficient for supramaximal stimulation (76%, 92%, and 89% of the cases in the common peroneal, sural, and superficial peroneal nerves, respectively).
Supramaximal stimulus intensity may be helpful in interpreting NCS results. A study by Parker et al. [23] showed that supramaximal stimulus intensity in chronic inflammatory demyelinating neuropathy (CIDP) and Charcot Marie Tooth type 1 or 4C (CMT) were significantly higher than in normal controls, while that of amyotrophic lateral sclerosis (ALS), carpal tunnel syndrome (CTS), and acquired inflammatory demyelinating neuropathy (AIDP) were similar to normal. Such information, combined with our suggested normative data, can help practitioners form clinical impressions when such diagnoses are suspected.
In all four nerves, supramaximal stimulus intensity was correlated with BFM, while BMI, SMM, and SLM failed to show a consistent correlation with supramaximal stimulus intensity. More subcutaneous fat would mean a deeper location of the nerve from the skin, which would require a stronger stimulus to achieve the same level of nerve stimulation. This correlation indicates that our NCS protocol was executed to achieve optimal results.
Proximal amplitude & area reduction compared to distal stimulus
We observed that the cut-off values for normal tibial nerve amplitude and area reduction are 40% and 30%, respectively, between the ankle and knee. For the common peroneal nerve, an amplitude reduction of approximately 30% and an area reduction of approximately 20% could be seen as normal. Some empirical data for amplitude and area reduction also show similar findings [24-28]. For the common peroneal nerve, an amplitude reduction of 30% and area reduction of 25% were viewed as normal in several studies [25-28], and for the tibial nerve, an amplitude reduction of up to 40% and an area reduction of up to 25% were observed in the normal population [24,25,27].
The diagnosis of partial conduction block in the lower extremity is often ambiguous and difficult to make, as temporal dispersion can be physiologically seen along the length of the nerve, even in the normal population. According to Olney consensus criteria [29] for the diagnosis of partial conduction block published in 1999, a probable partial conduction block can be diagnosed if there is an amplitude reduction of >50% or area reduction of >40% for both the tibial and peroneal nerves in the leg segment. If the amplitude reduction exceeds 60% or the area reduction exceeds 50%, a definite partial conduction block can be diagnosed. Comparing this result with our normal value limits gives a “gray zone,” in which area reduction or amplitude reduction is too big to be seen as normal, but too small to be deemed as partial conduction block. In such cases, the clinical correlation of the results with the participant’s symptoms is essential. Further research is warranted to narrow down the “gray zone” and develop a more specific diagnostic criterion for partial conduction block.
Side-to-side difference
Several studies have demonstrated and evaluated side-to-side differences in lower extremity NCS [5,6,9,10]. Buschbacher [6,9,10] presented that for the tibial, peroneal, and sural nerves, the upper limit of side-to-side difference in onset latency is 1.3 ms, 1.4 ms, and 0.4 ms, respectively by the mean+2SD method. Our corresponding results are 1.37 ms, 1.26 ms, and 0.35 ms, respectively, which are reasonably similar to those of Buschbacher’s. Side-to-side differences in amplitude and velocity for the three nerves showed similar results as well. Roughly, there is a tolerable 50%–60% difference in amplitude and 15%–20% difference in NCV for the tibial and common peroneal nerves. For the sural nerve, our results showed an upper limit of 27% and 35% side-to-side difference in Ampbase-peak and Amppeak-peak, which was very similar to Buschbacher’s results of 28 and 32%, respectively. Despite the differences in ethnicity, age distribution, and height, our results are similar to those of Buschbacher’s previous results [6,9,10].
However, we could not find any reports evaluating the side-to-side difference in the superficial peroneal nerve. Contrary to the general concern regarding the high variability and technical difficulties in detecting superficial peroneal nerve, the results for side-to-side difference did not differ much from those of the sural nerve. Our results on side-to-side comparisons can be helpful in diagnosing unilateral pathological conditions.
Again, as in the case of amplitude and area reduction, there lies a “gray zone” regarding the side-to-side difference, where the absolute values of a parameter from both limbs are within the normal range, yet the side-to-side difference exceeds the upper limit. Whether it should be deemed as pathologic or tolerable should be a clinical decision based on the patient’s subjective symptoms and other clinical signs. Further studies should be carried out with patients with neurologic symptoms to further narrow down this “gray zone.”
Limitations
The main limitation of our study was the age of the participants. Most studies included in the NDTF report included participants from a wide spectrum of ages, and results were typically reported in two or three separate age groups [7]. According to Korea’s Healthcare Bigdata Hub, the most frequent age group on which NCS was performed was the 50s. Therefore, the authors decided to enroll those in their 50s to ensure that our results can be practically utilized in clinical settings. Those in their 20s were selected as a healthy comparison group for those in their 50s. However, we acknowledge the limited reliability of our results when applied to those not in their 20s or 50s. This NCS standardization project is still in progress, with further studies being carried out on other age groups as well to develop truly representative reference standards.
Another important limitation of this study is that it is unclear whether this vast set of reference standards could improve disease detection when applied in actual clinical settings. We recruited only healthy volunteers to establish a thoroughly explored reference standard that can be applied across different institutes and clinical settings. Participants with any evidence of peripheral neuromuscular problems were excluded; thus, the application of our results to symptomatic patients is beyond the scope of this study. Further studies are warranted to test the diagnostic utility of our results.
One other limitation is the lack of diversity in the electrodiagnostic apparatus. All three hospitals adopted the same Nicolet EDX system, and further studies should include data conducted with different hardware to test the reproducibility of our results.
Conclusion
This article presented vast normative reference data for NCSs of the lower extremities with a large sample population. Standardized test protocols were specified and conducted, and a thorough evaluation of uncertainty was performed, which has never been done before. We expect our results to guide clinicians and practitioners in performing and interpreting NCS.